Menu
Search
May 2021 San Francisco Real Estate Report

market report

May 2021 Newsletter | Real Estate Market Trends

12/7/21  |  Susie Lee

San Francisco Report | Median Home Sales | Year to Date

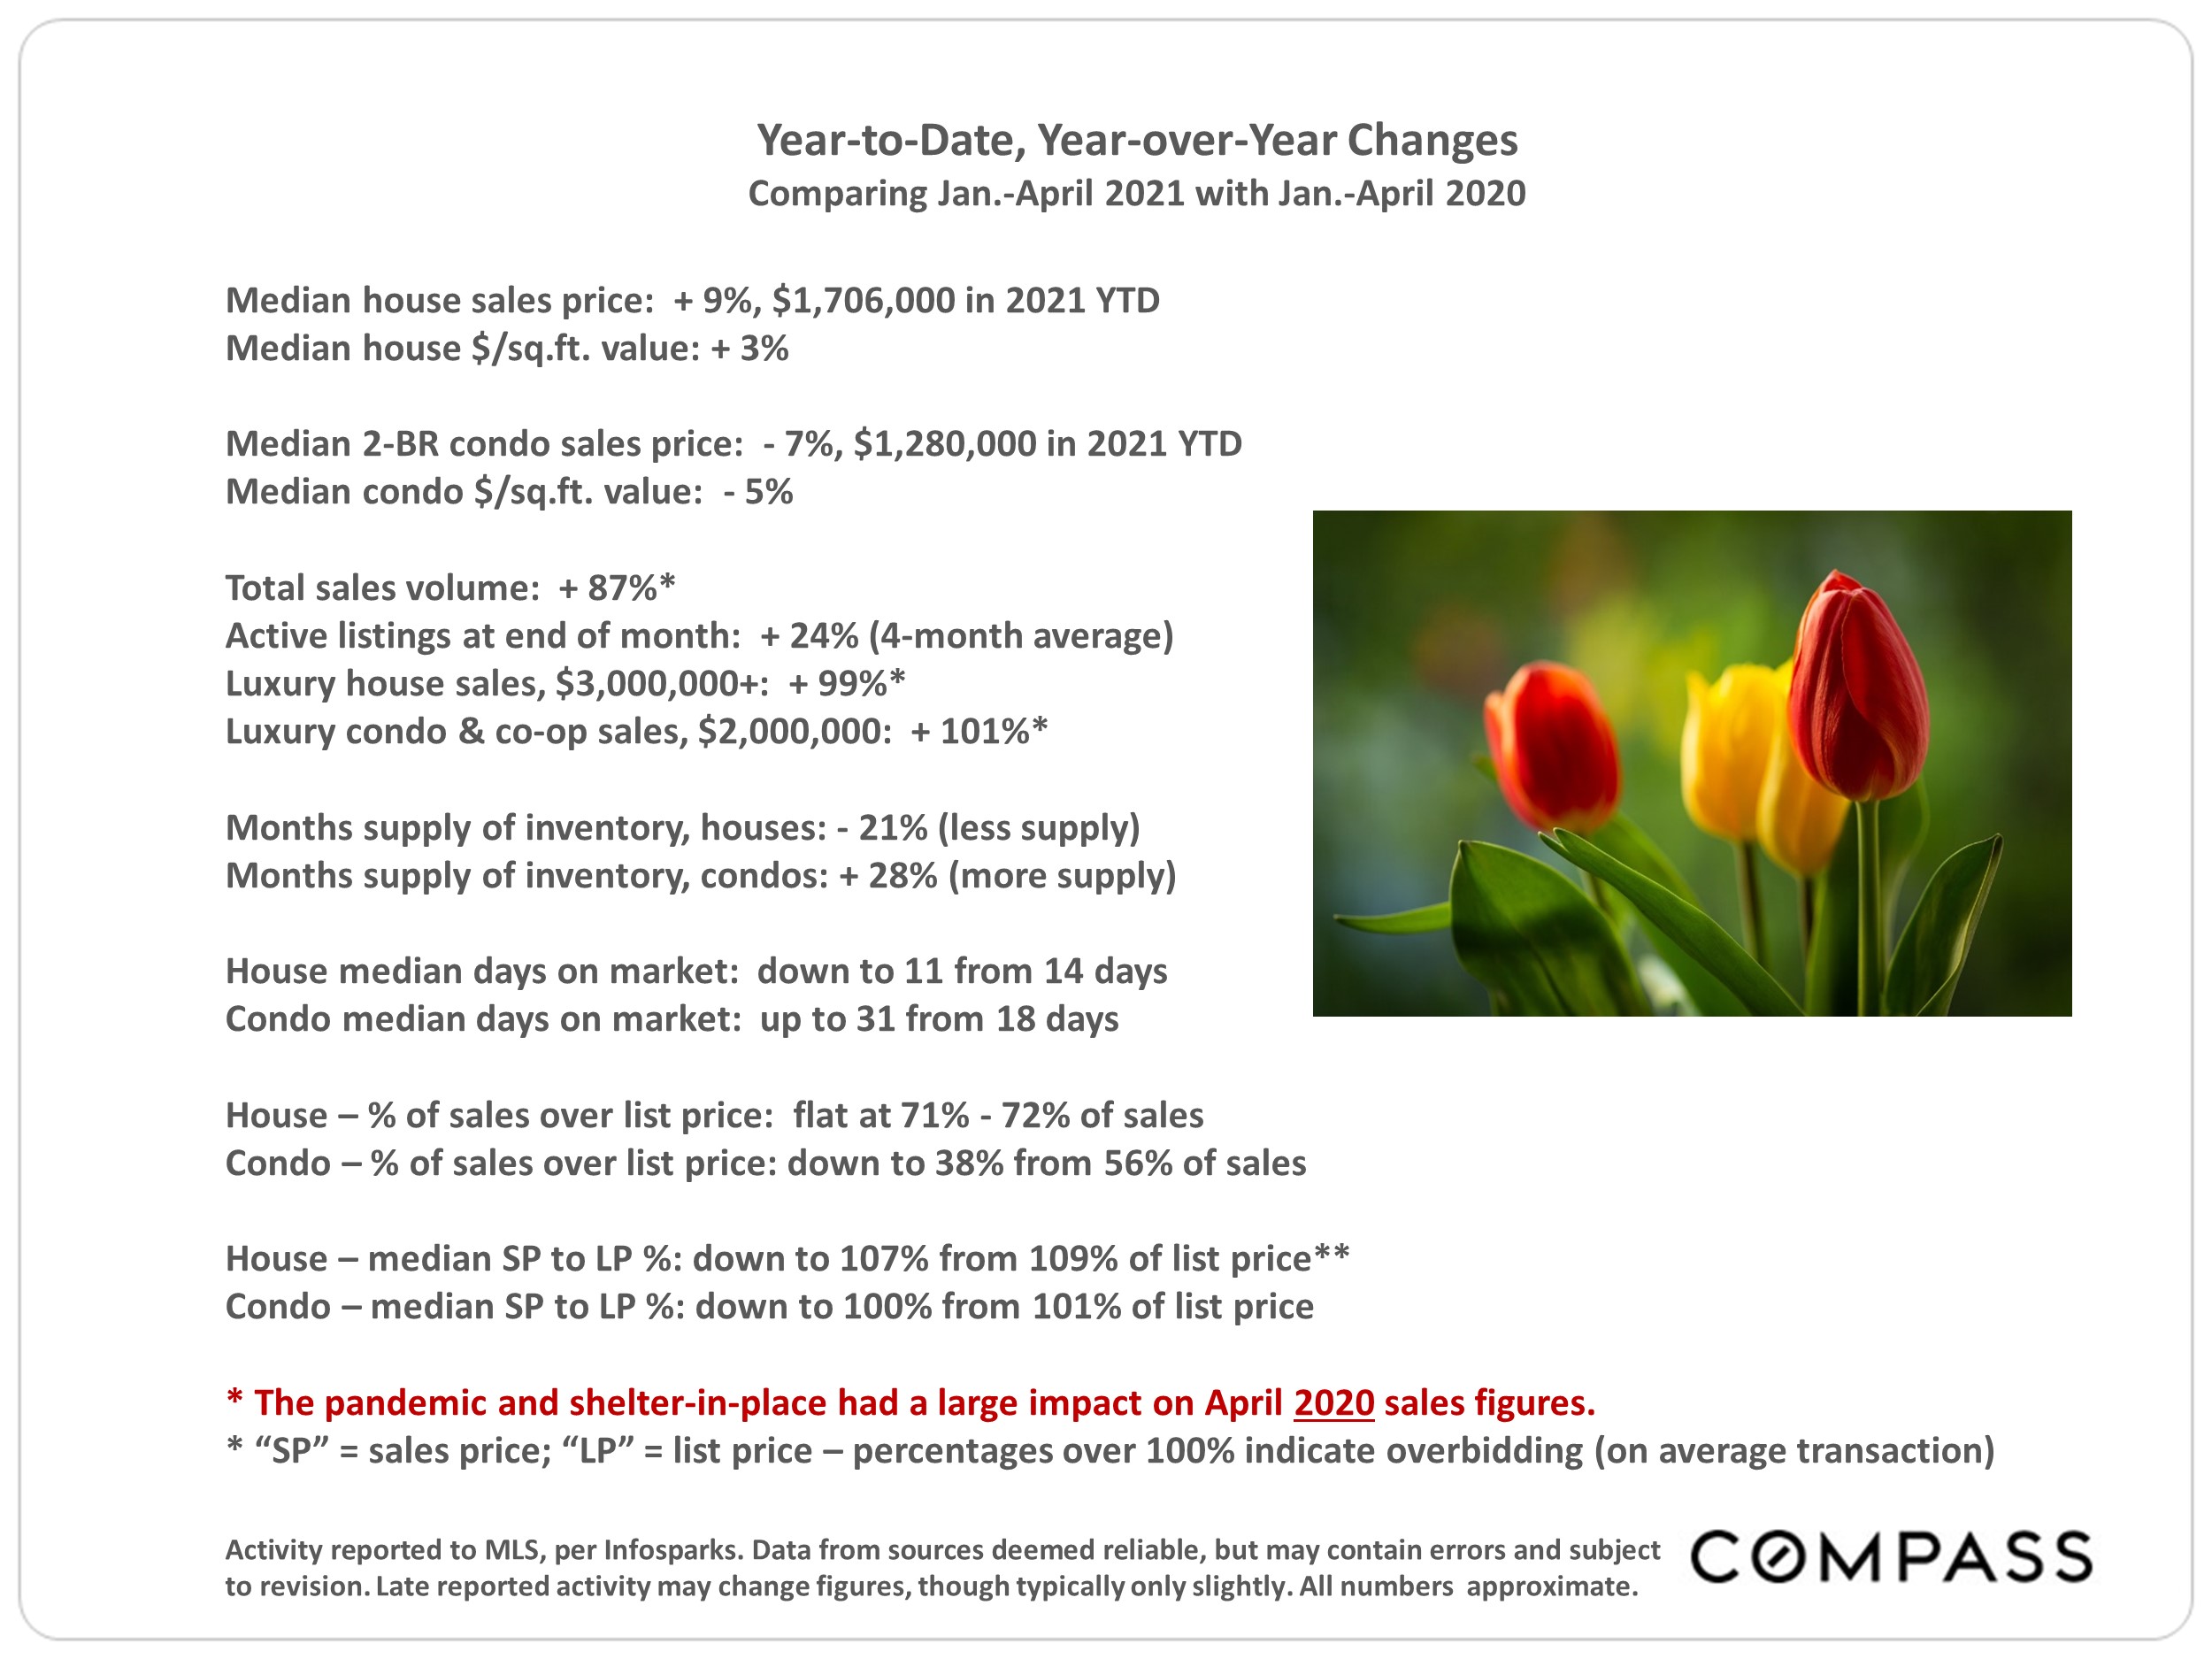
San Francisco market report comparing 2021 and 2020 housing statistics, with red and yellow tulips.

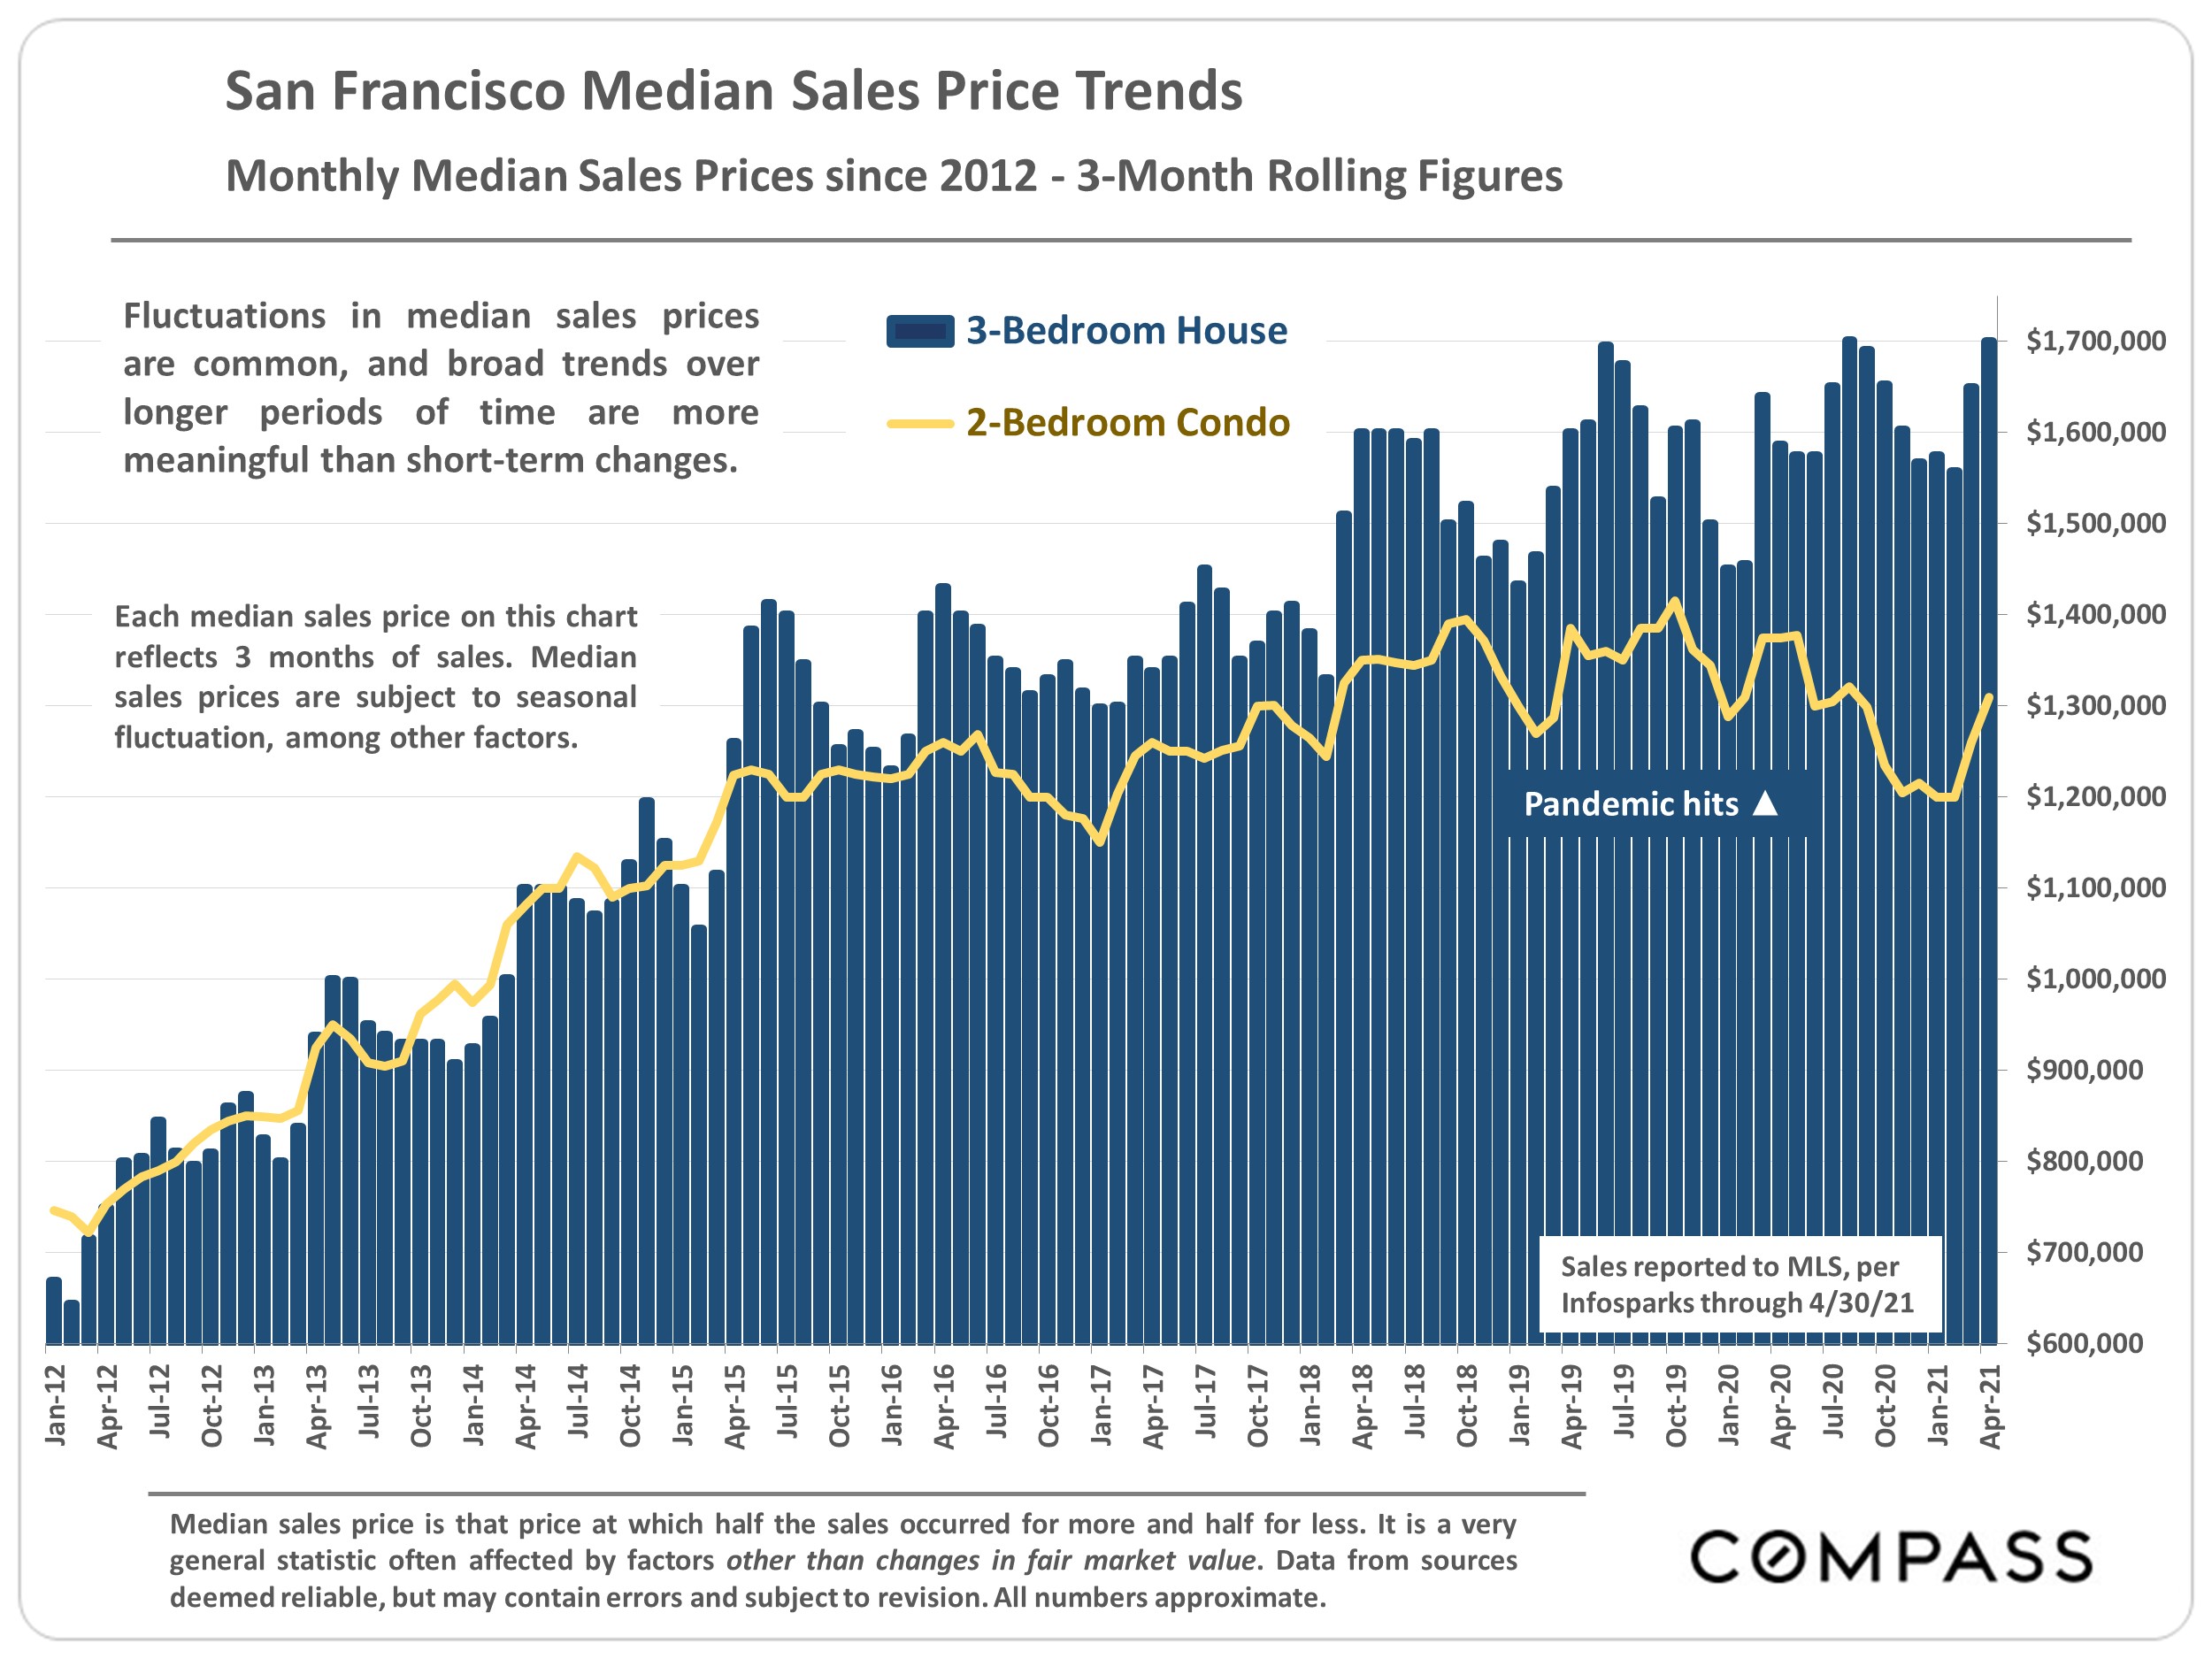
San Francisco median sales price chart, with house prices as blue bars and condo prices as a yellow line.

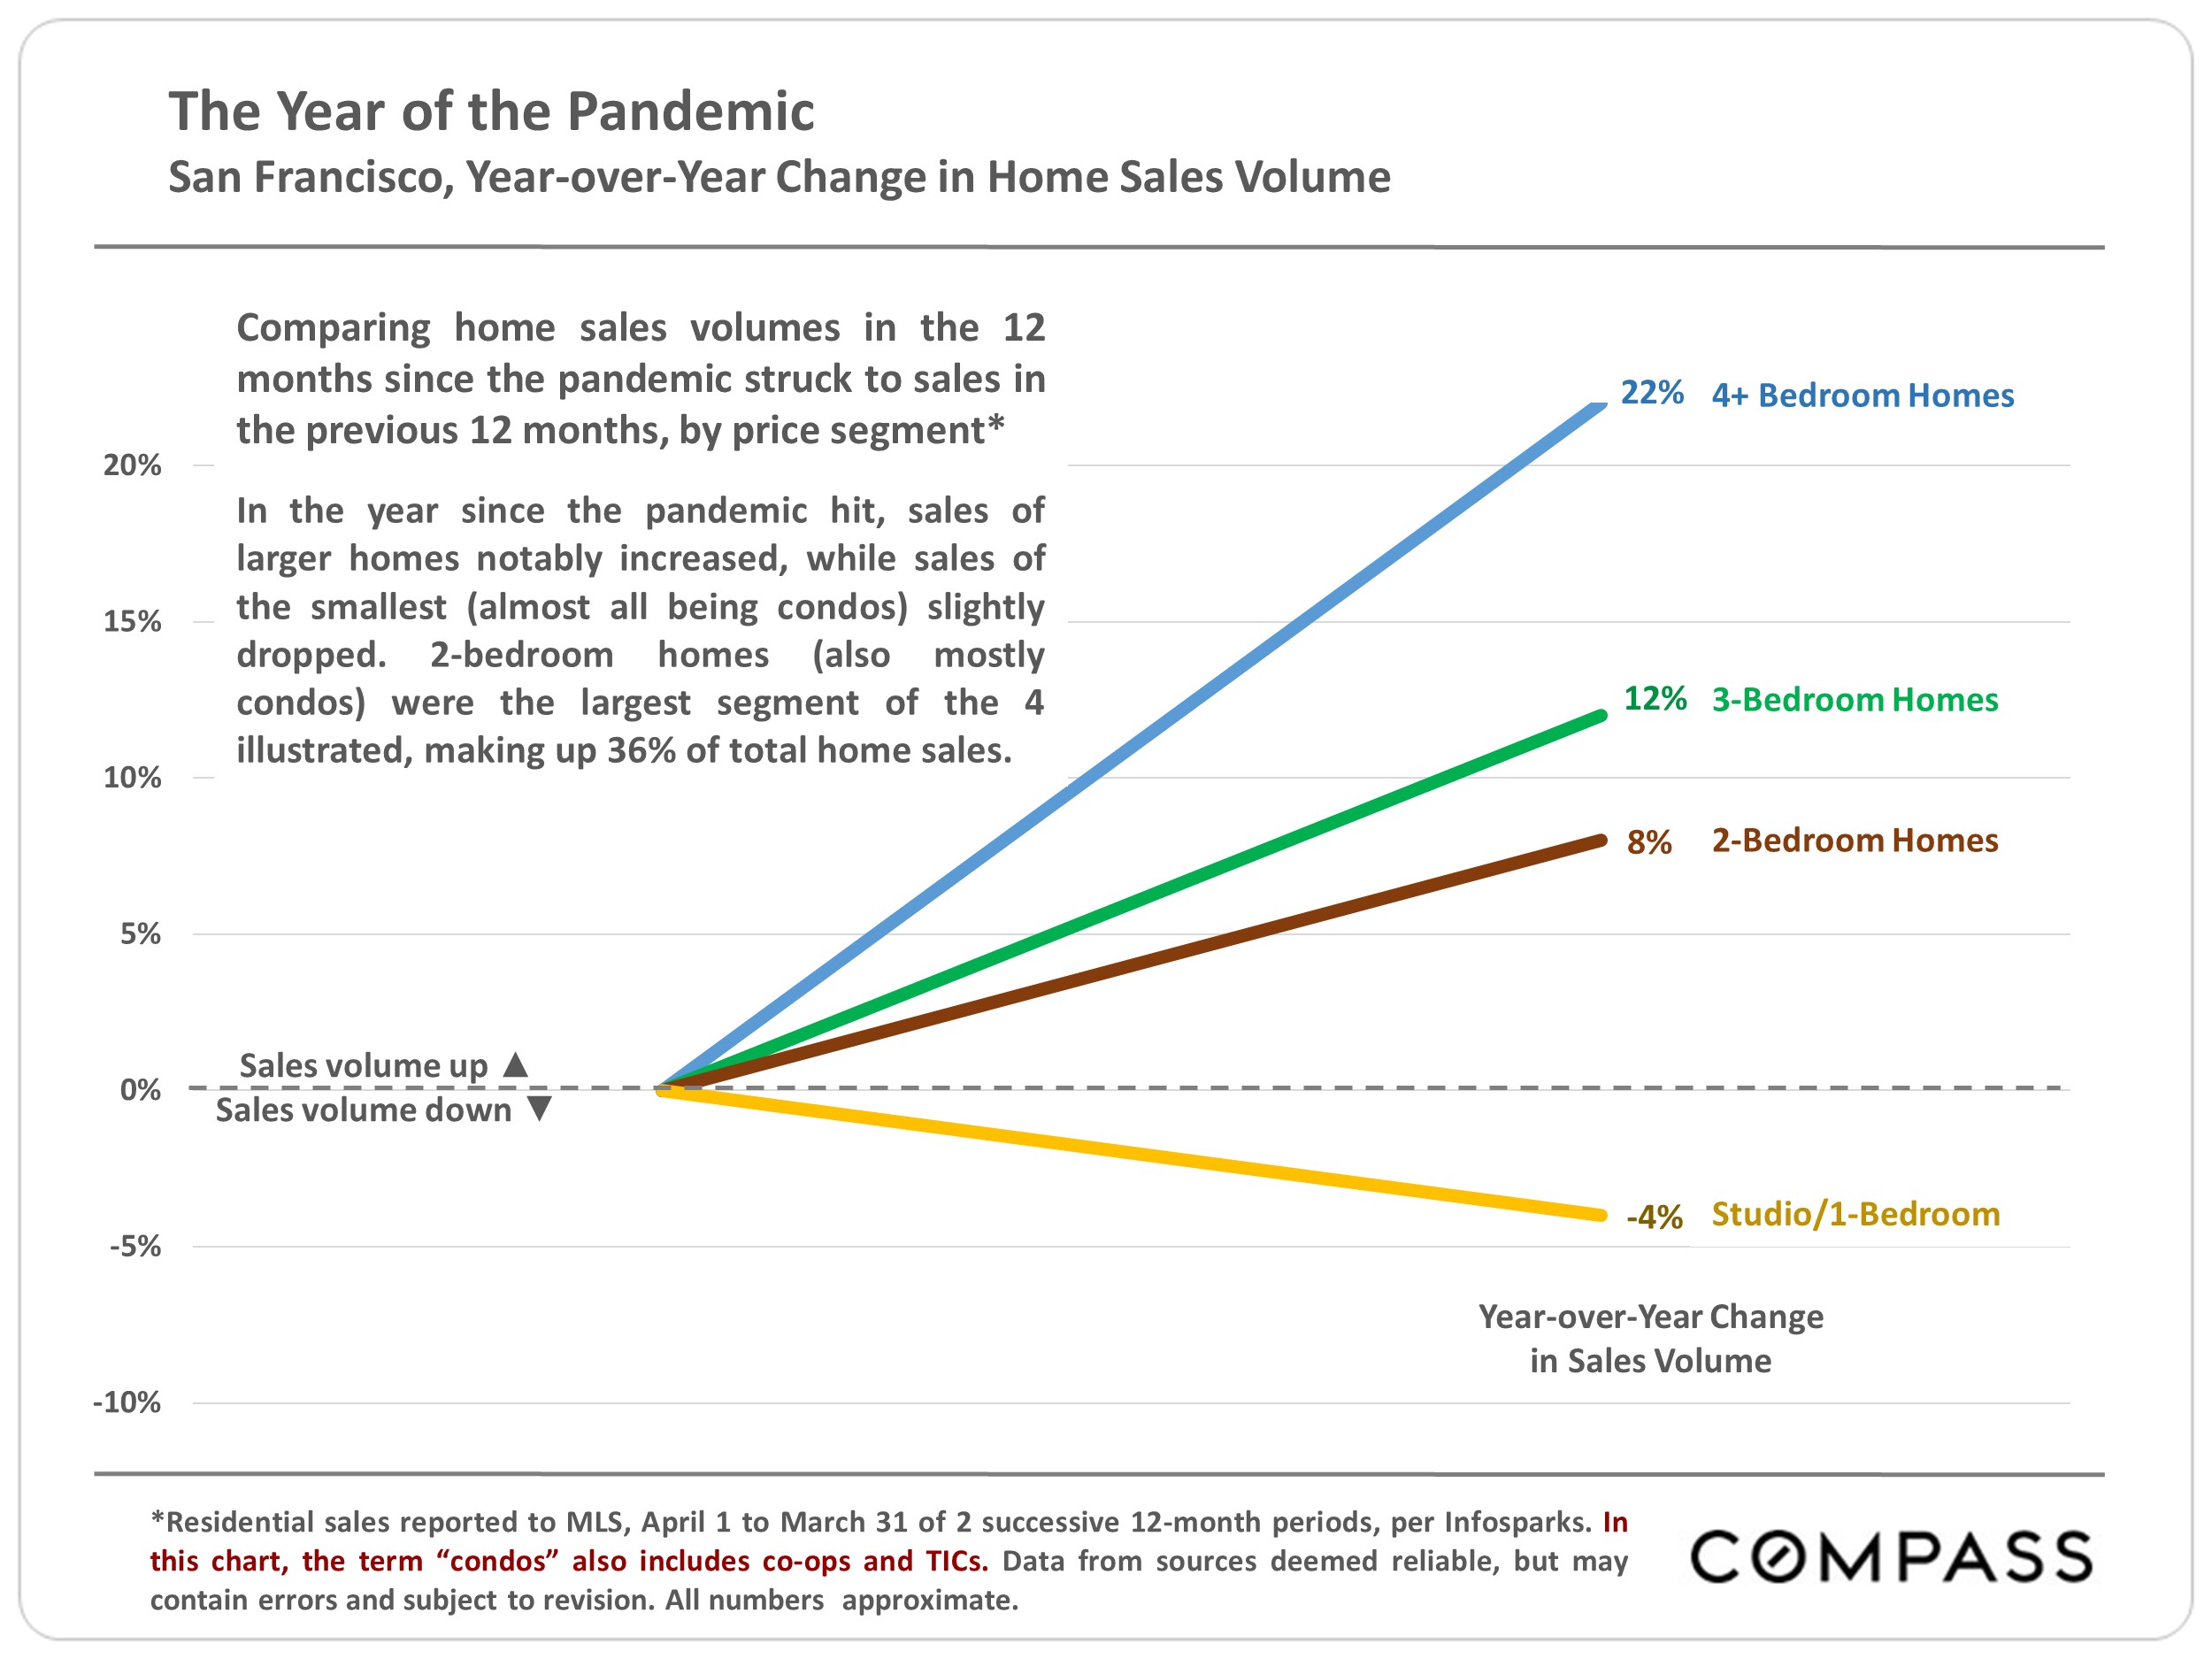
San Francisco home sales volume changes: 4+ bedrooms +22%, 3 bedrooms +12%, 2 bedrooms +8%, studios/1 bedroom −4%.

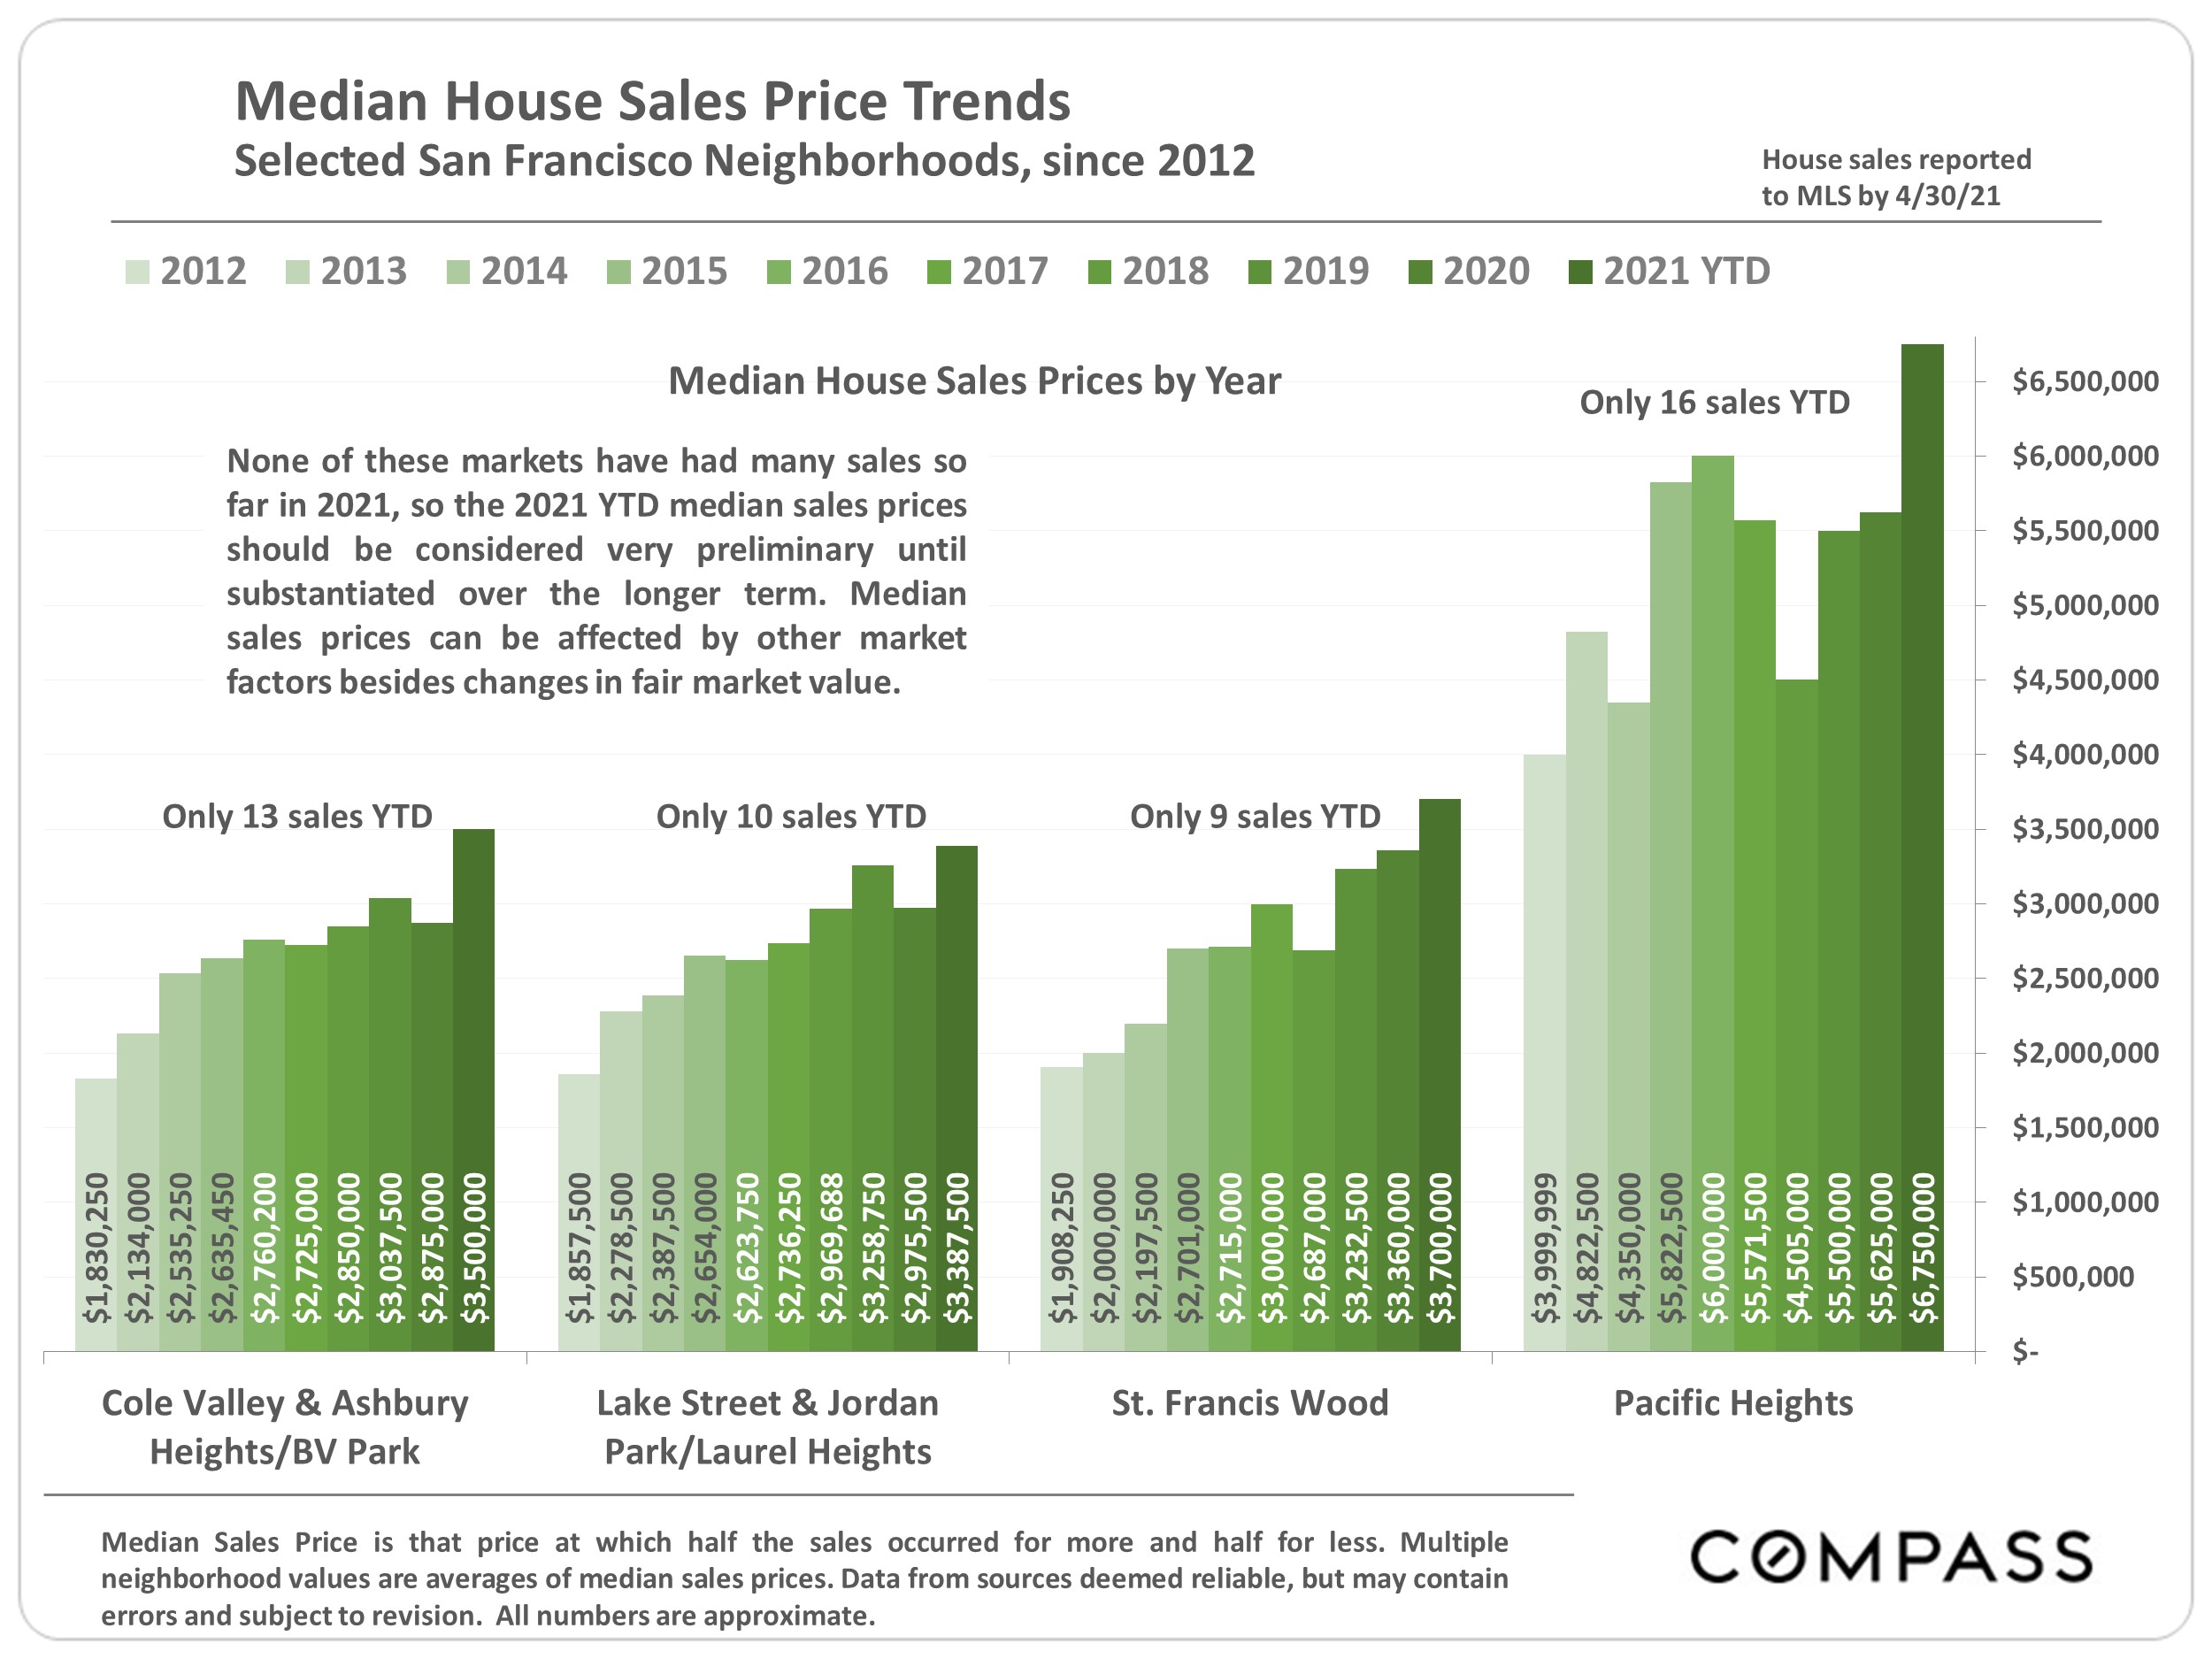
Chart comparing median house sale prices by year across four San Francisco neighborhoods.

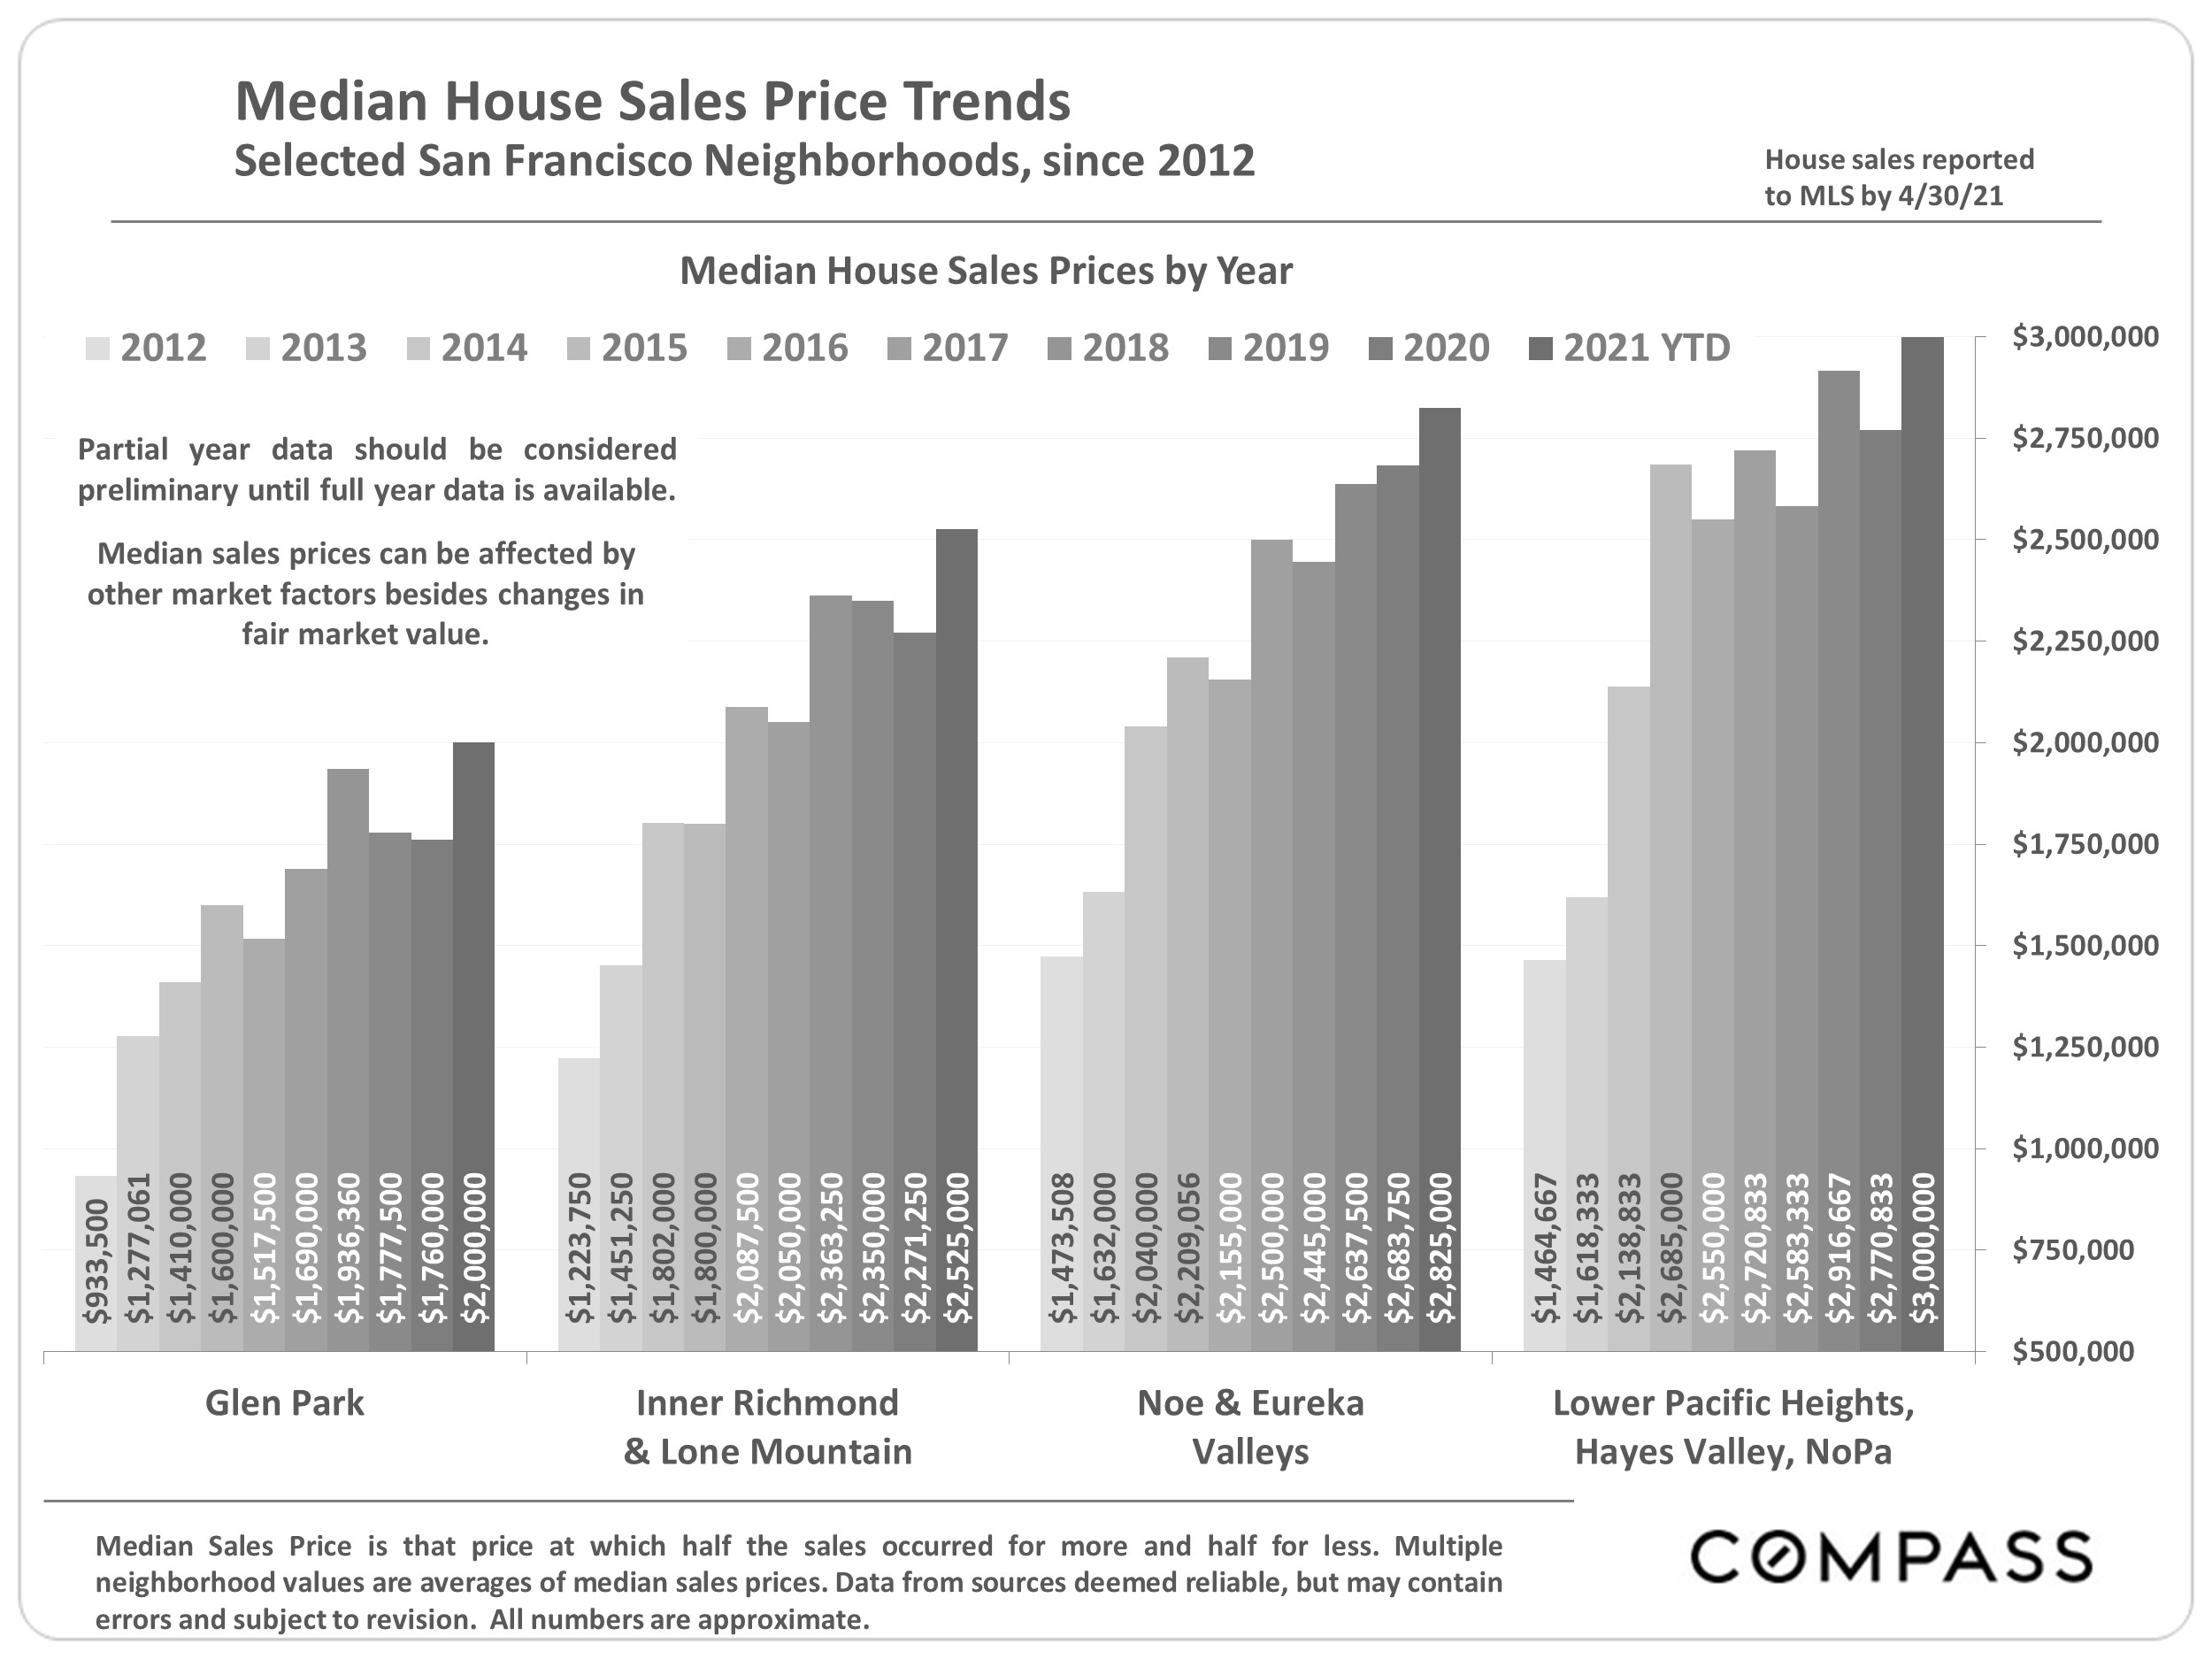
Chart of median house sale prices rising across four San Francisco neighborhood groups from 2012 to 2021 YTD.

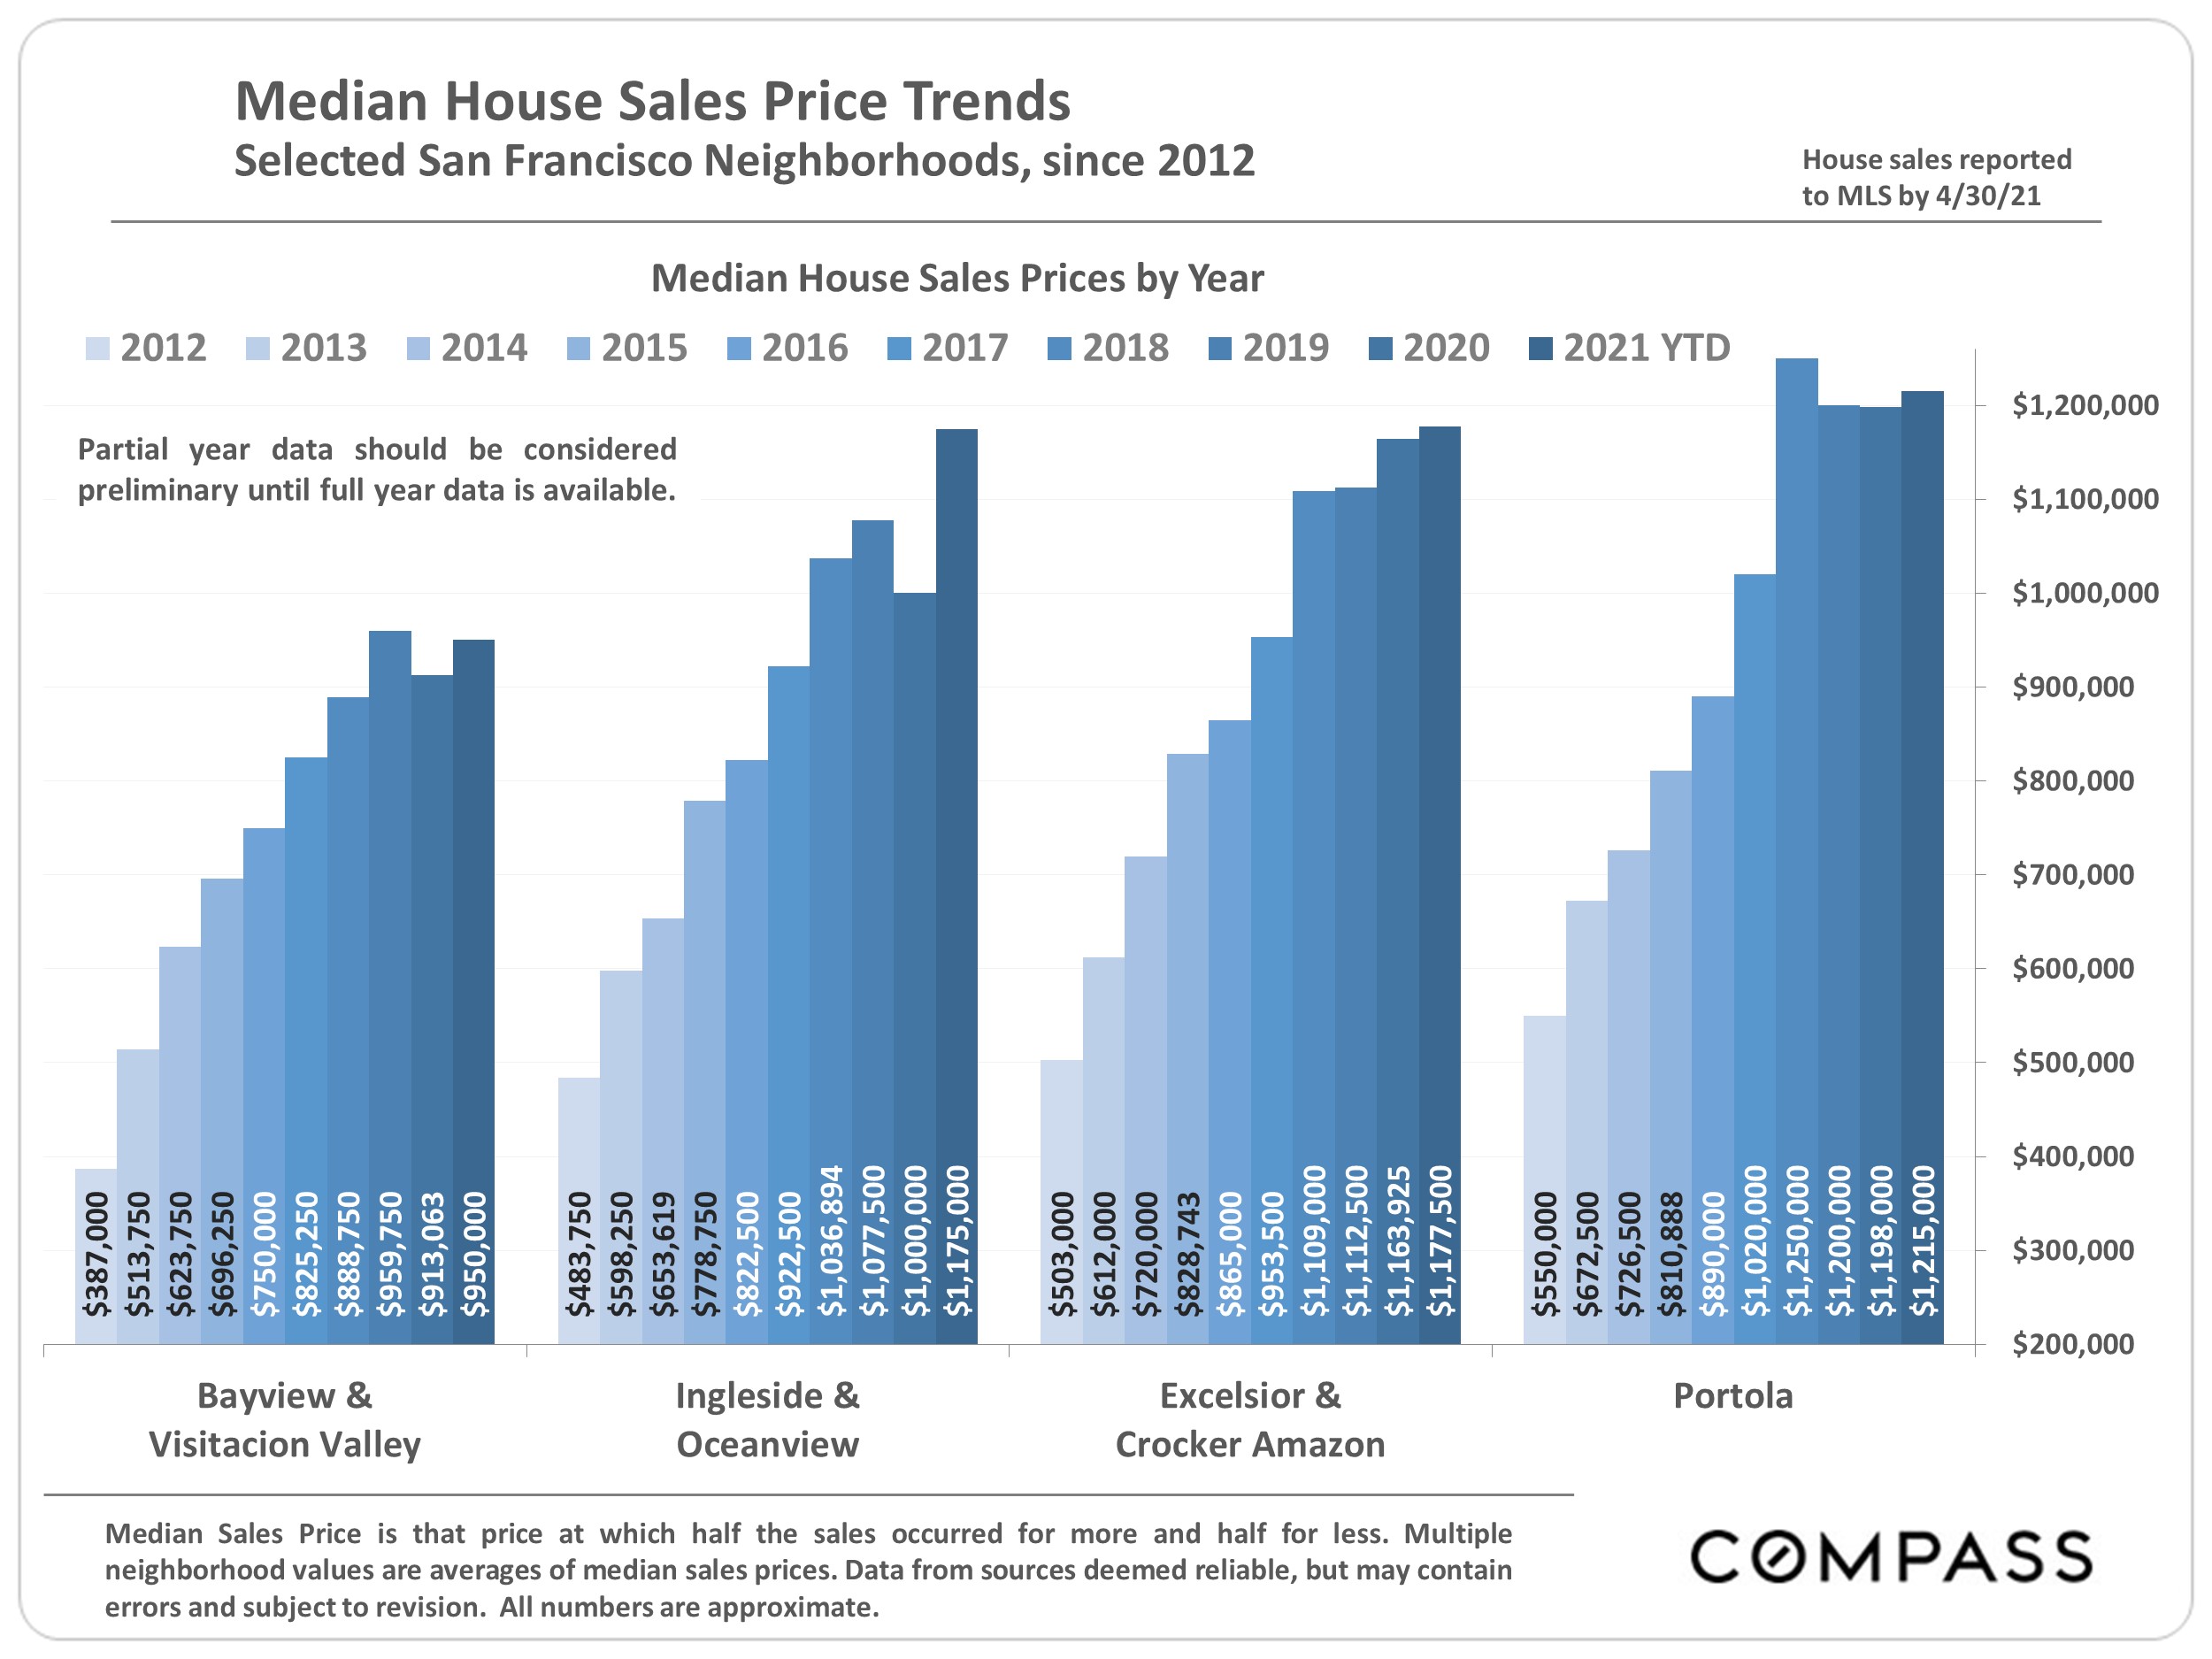
Bar chart comparing annual median house sale prices since 2012 across five San Francisco neighborhood groups.

Bar chart comparing median house sale prices by year across four San Francisco neighborhood groups, from 2012 to 2021 YTD.

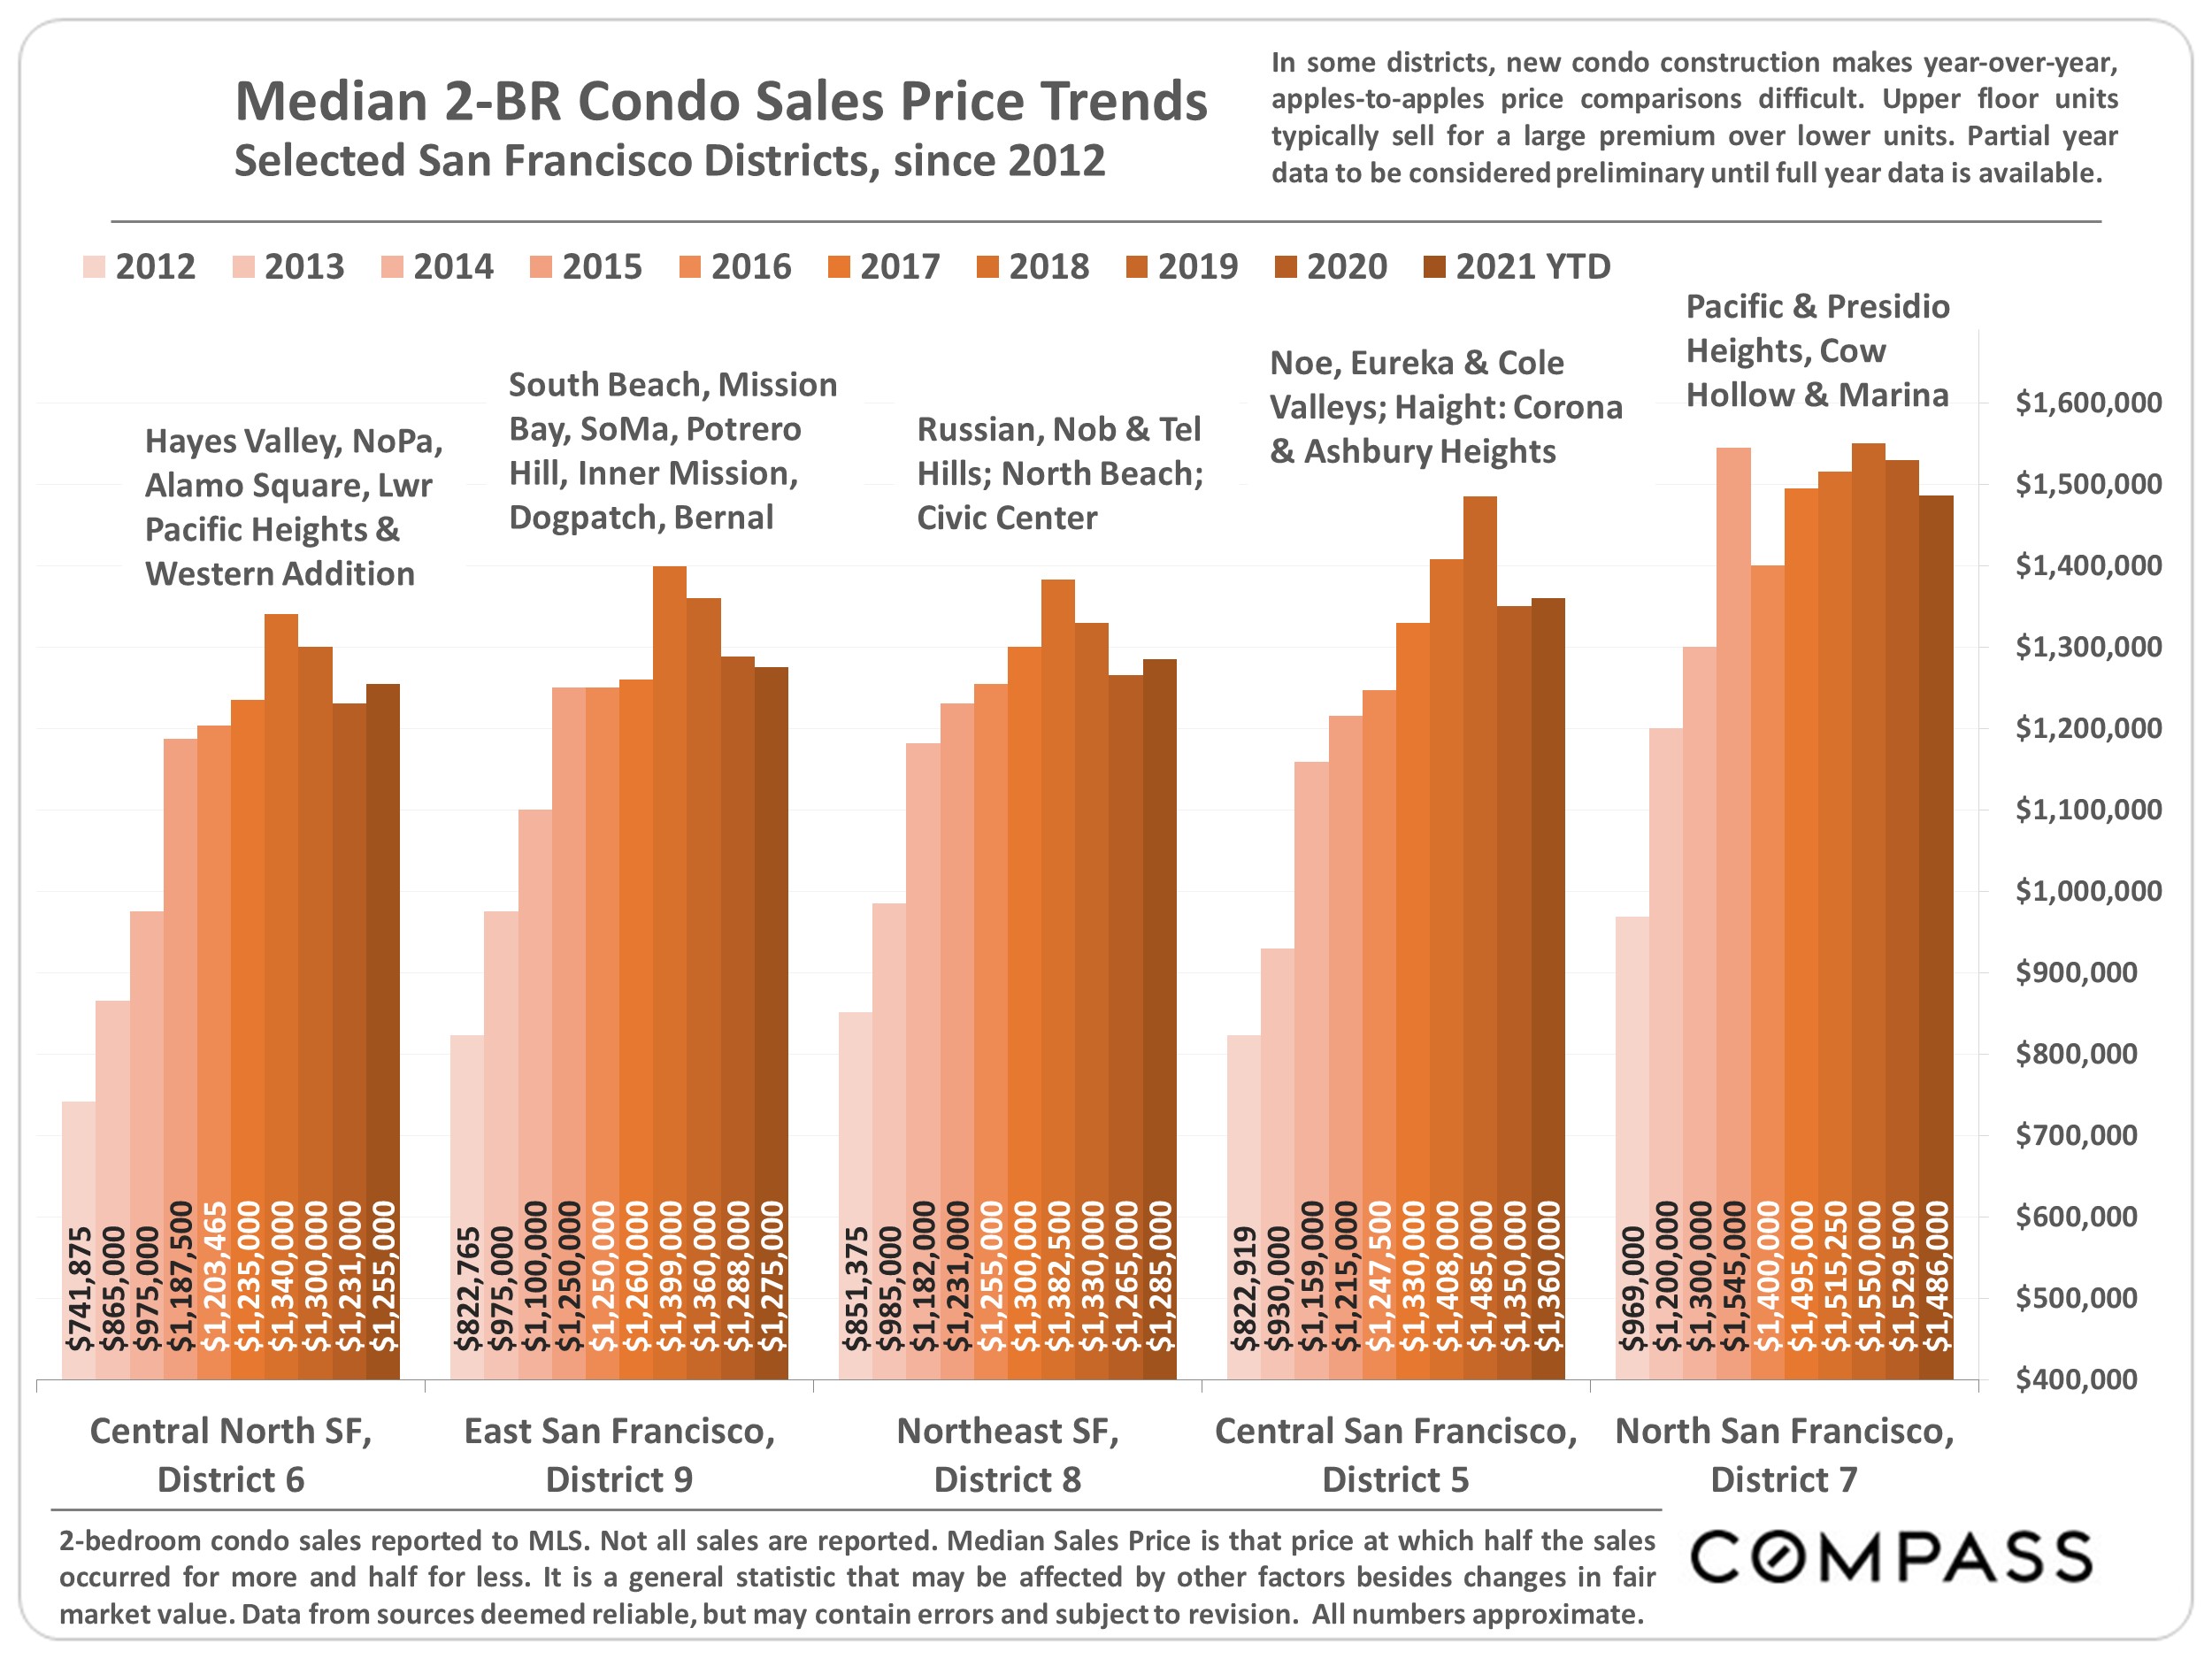
Bar chart comparing median two-bedroom condo sale prices across five San Francisco district groups, 2012–2021 YTD.

San Francisco monthly housing inventory supply chart, 2018–2021, comparing condos and lofts with single-family homes.

Chart comparing active and pending San Francisco house and condo listings from January 2019 to April 2021.

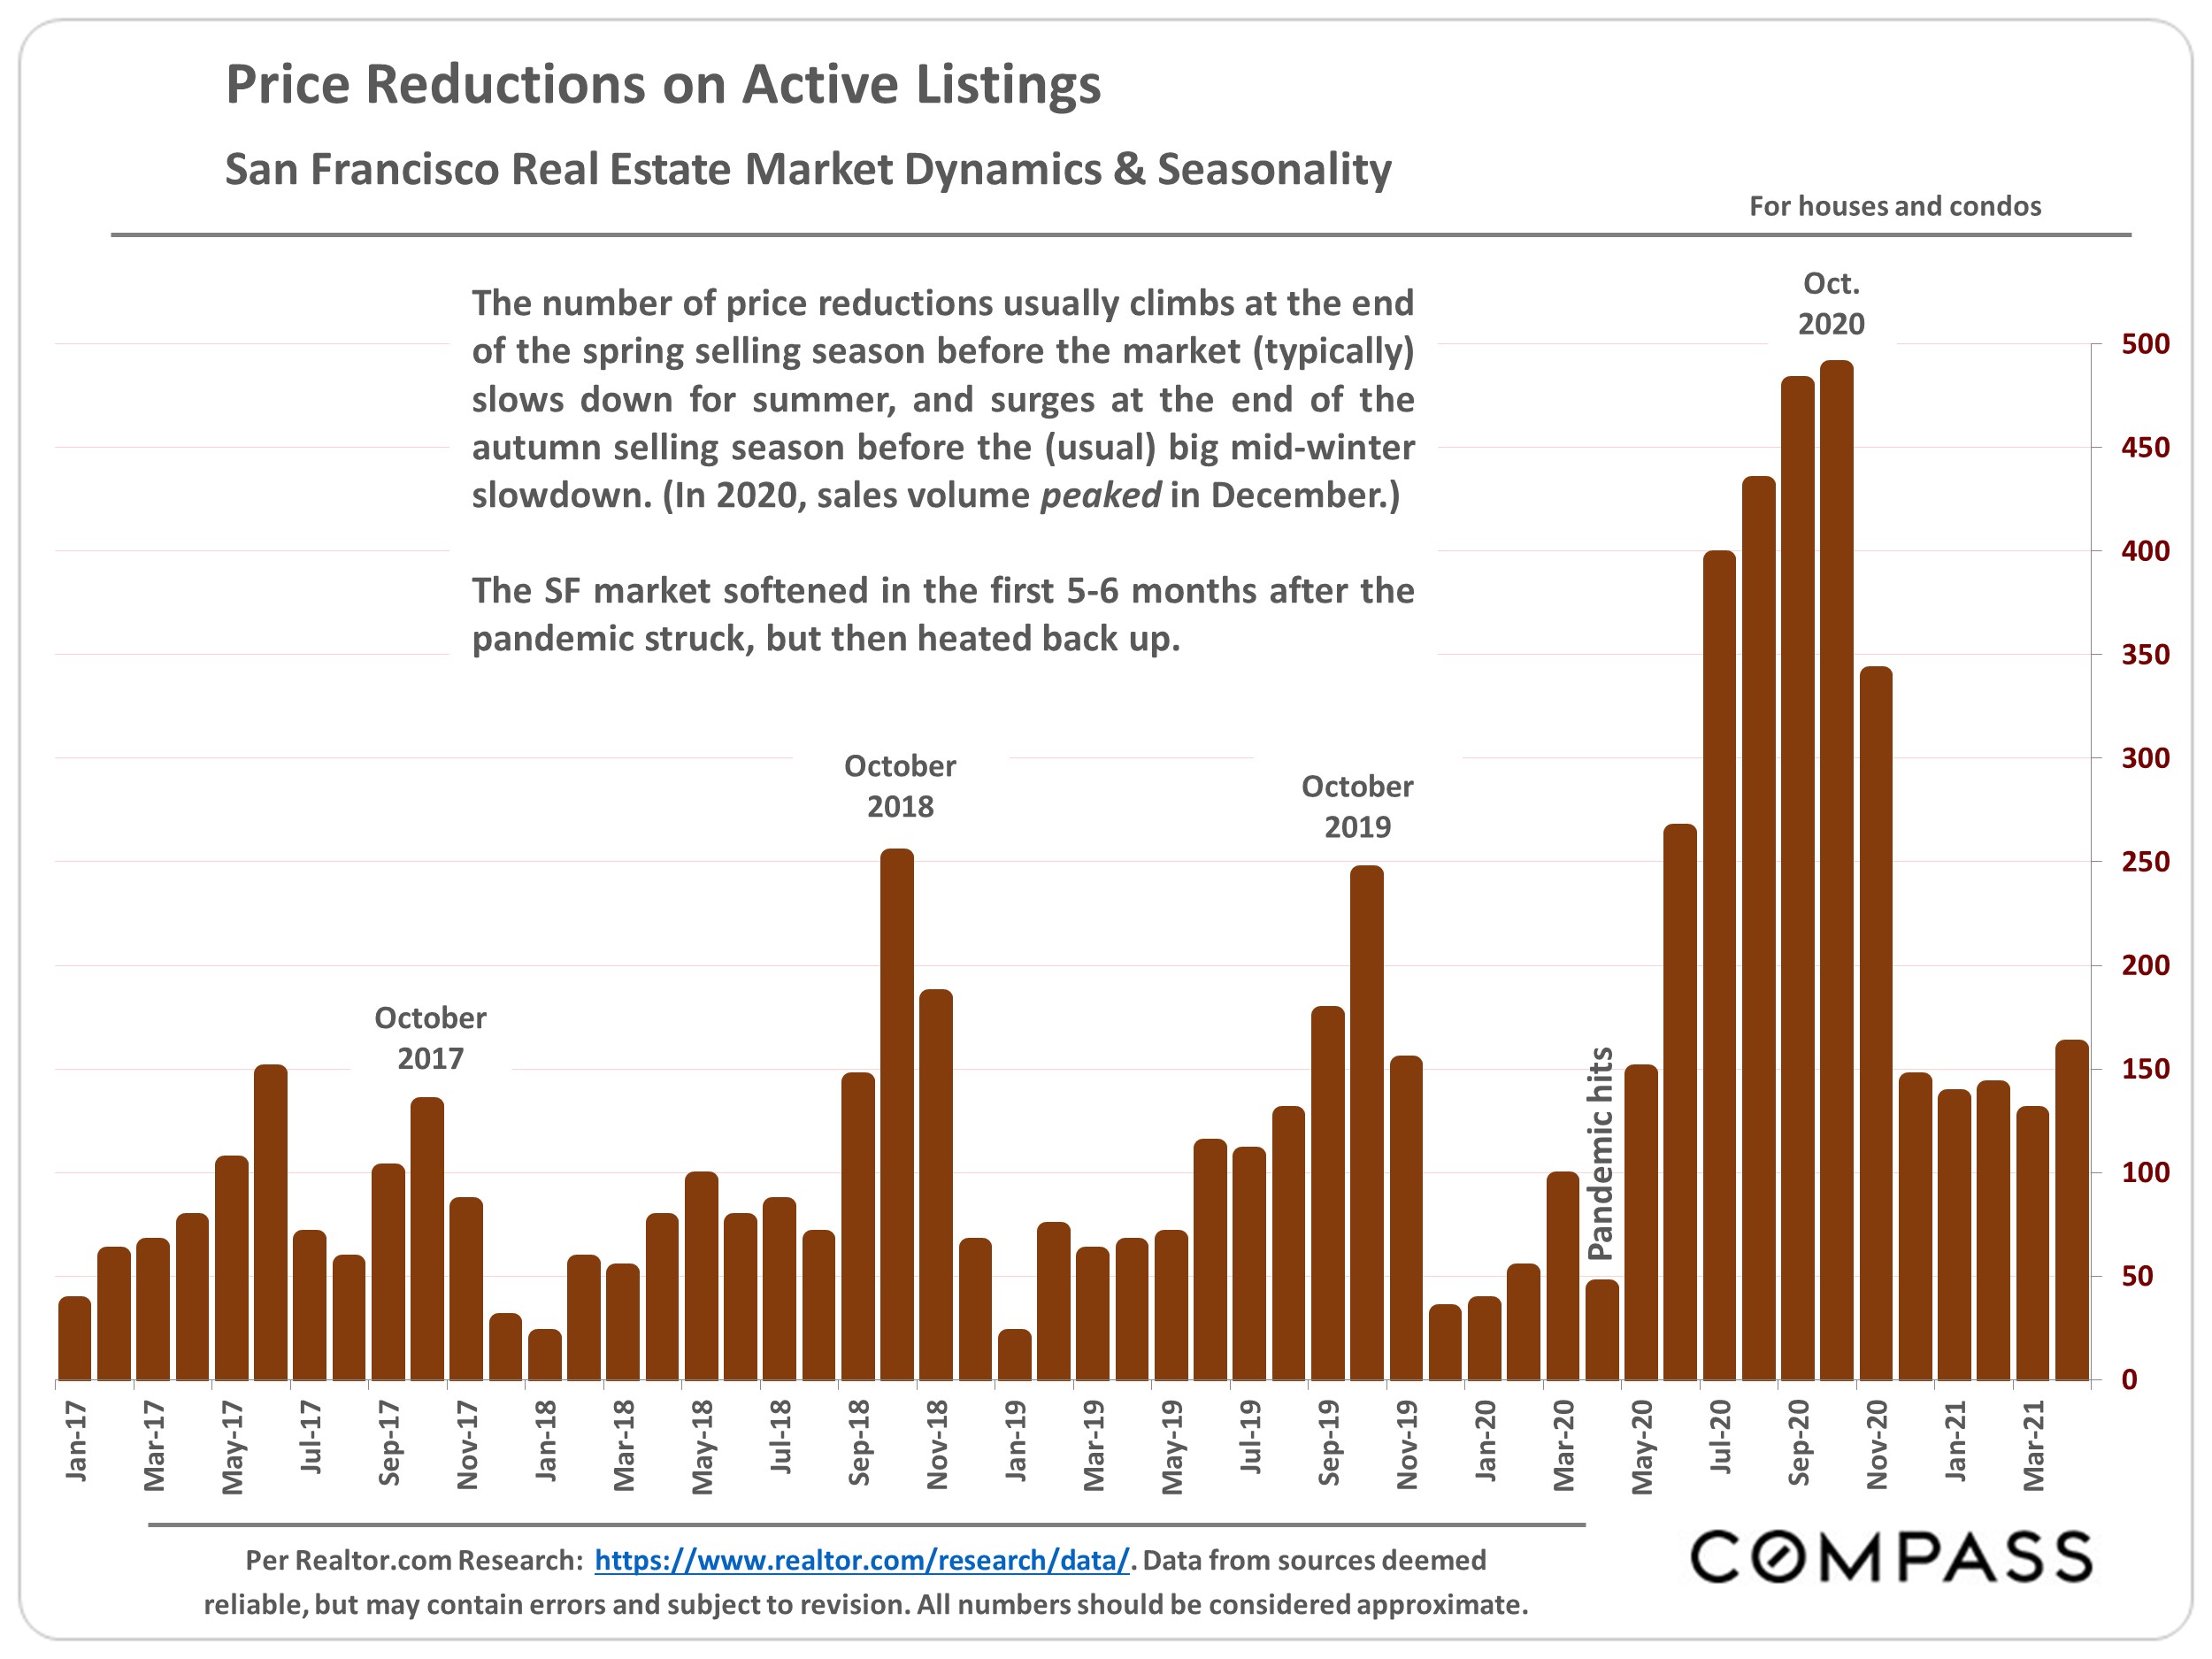
Bar chart of San Francisco listing price reductions, with a sharp surge in late summer and autumn 2020.

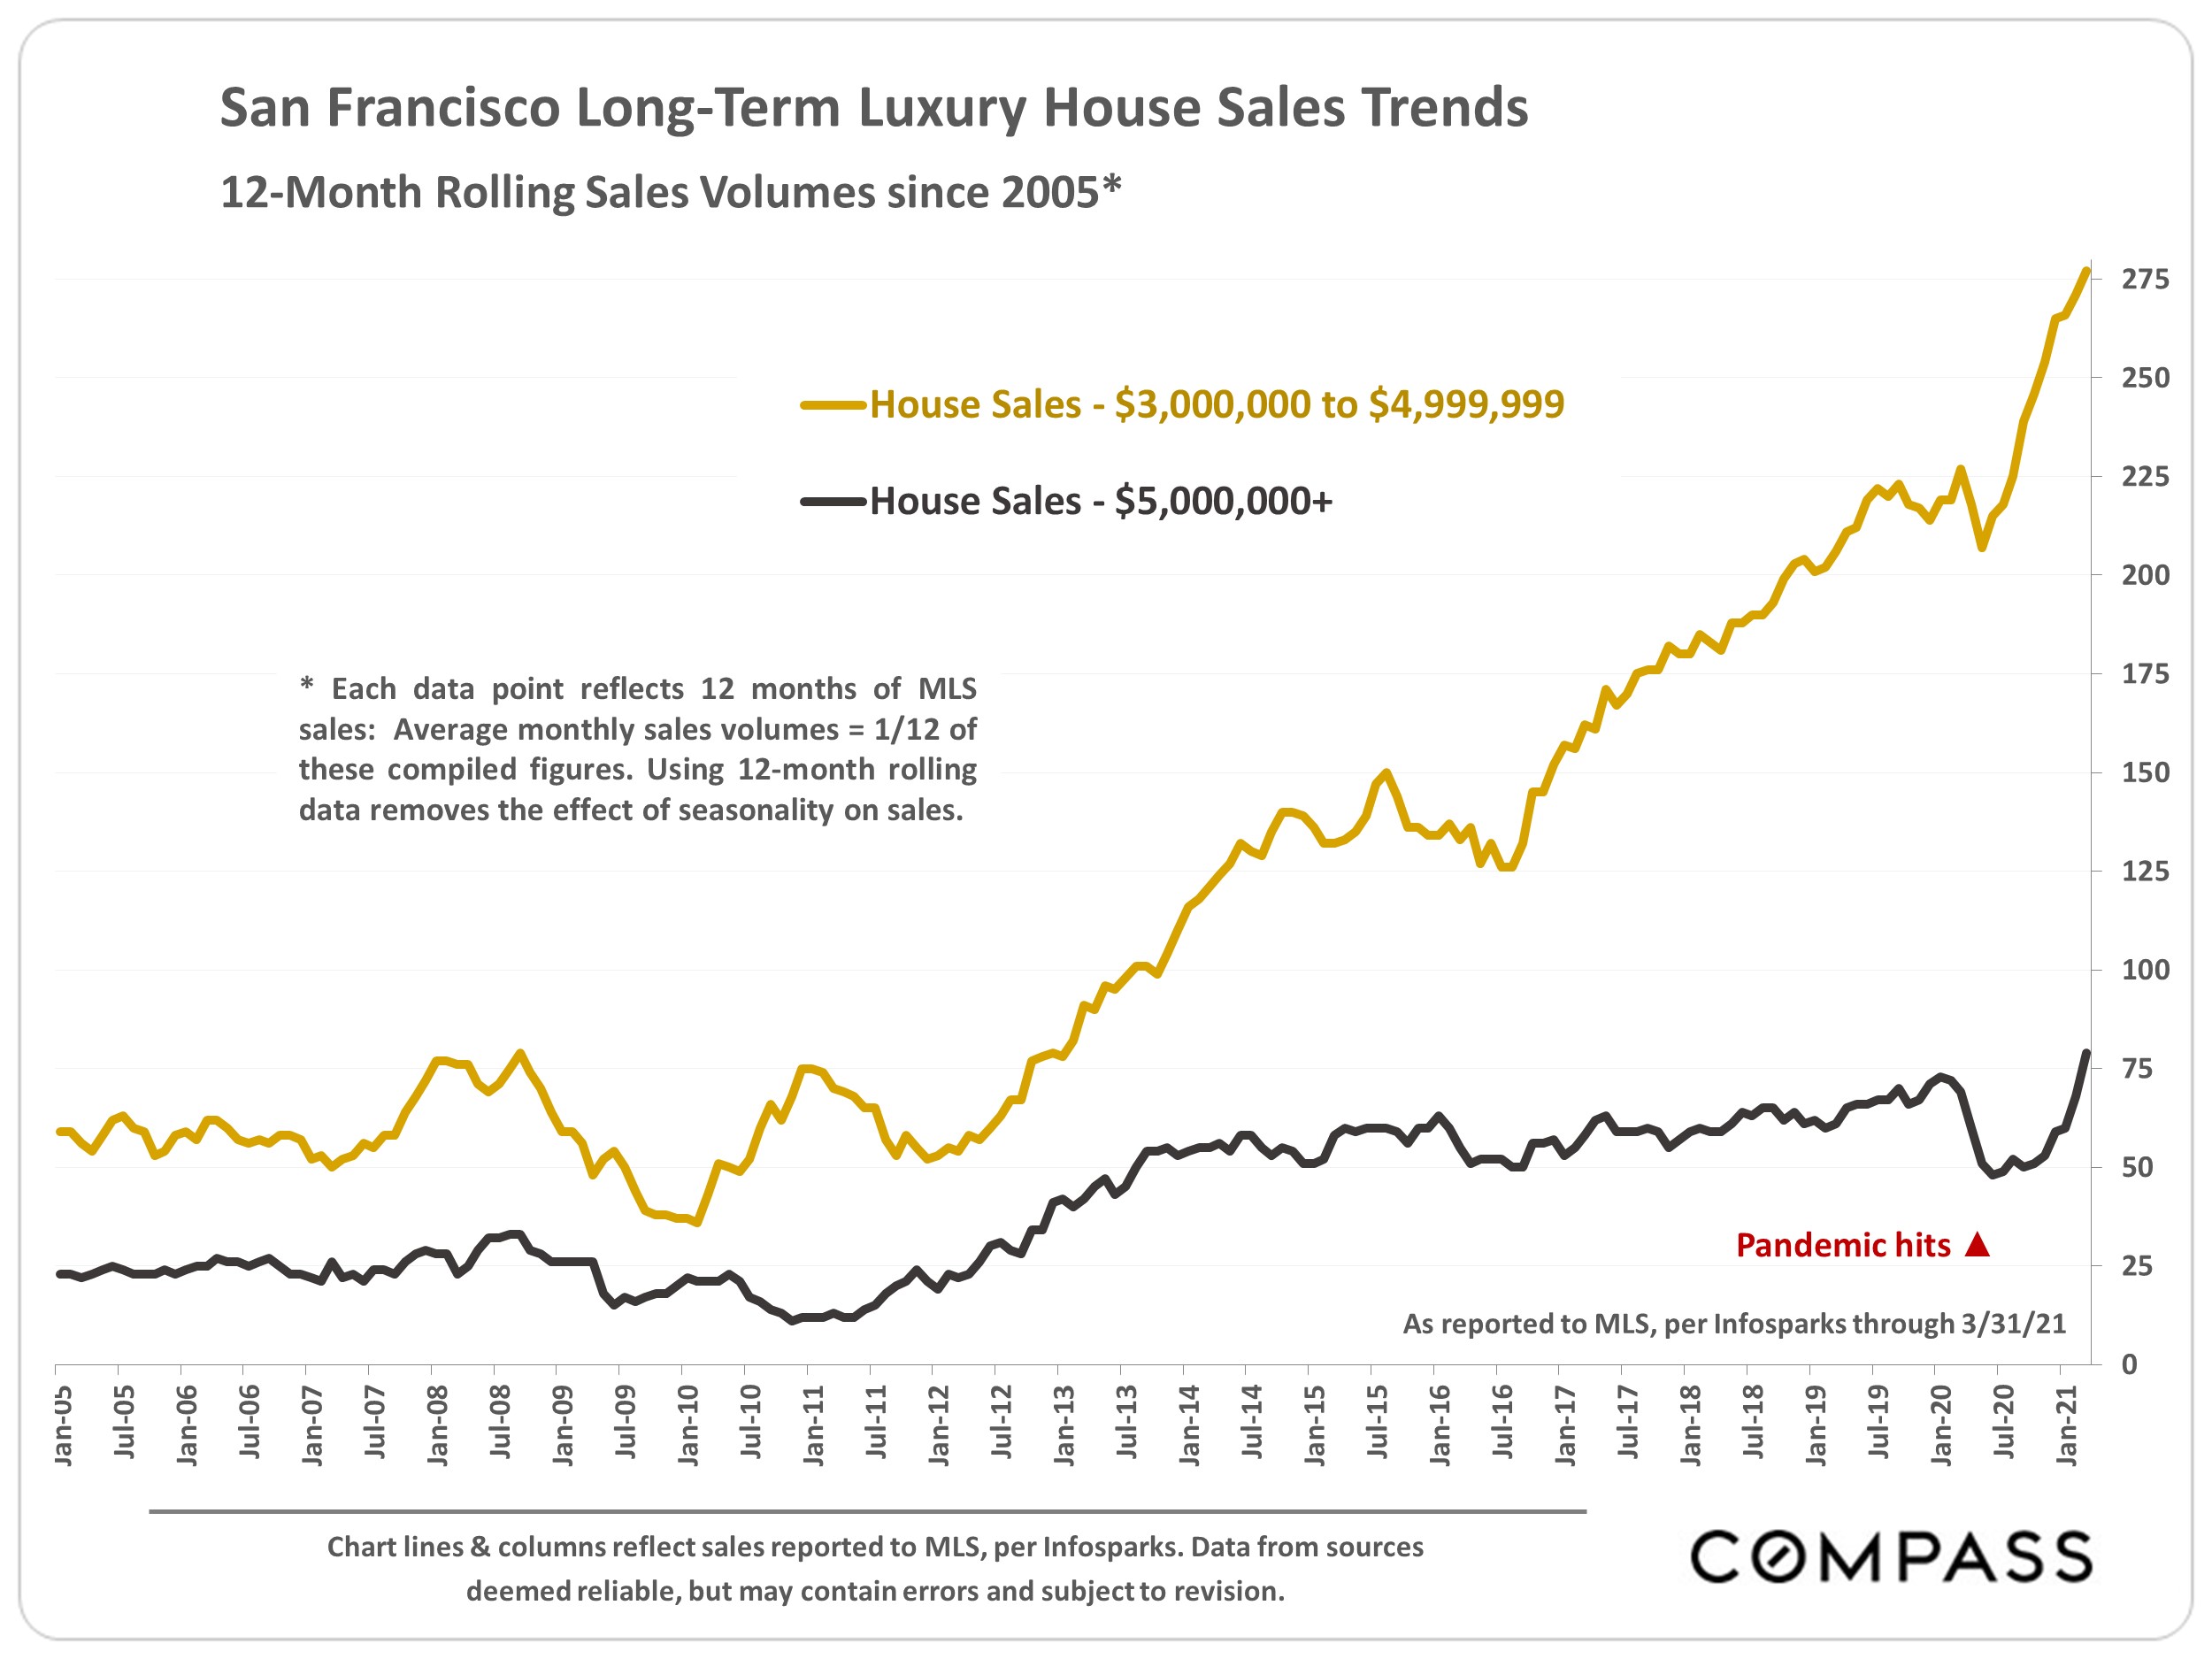
San Francisco luxury house sales trend chart, with the $3–5 million sales line rising sharply through January 2021.

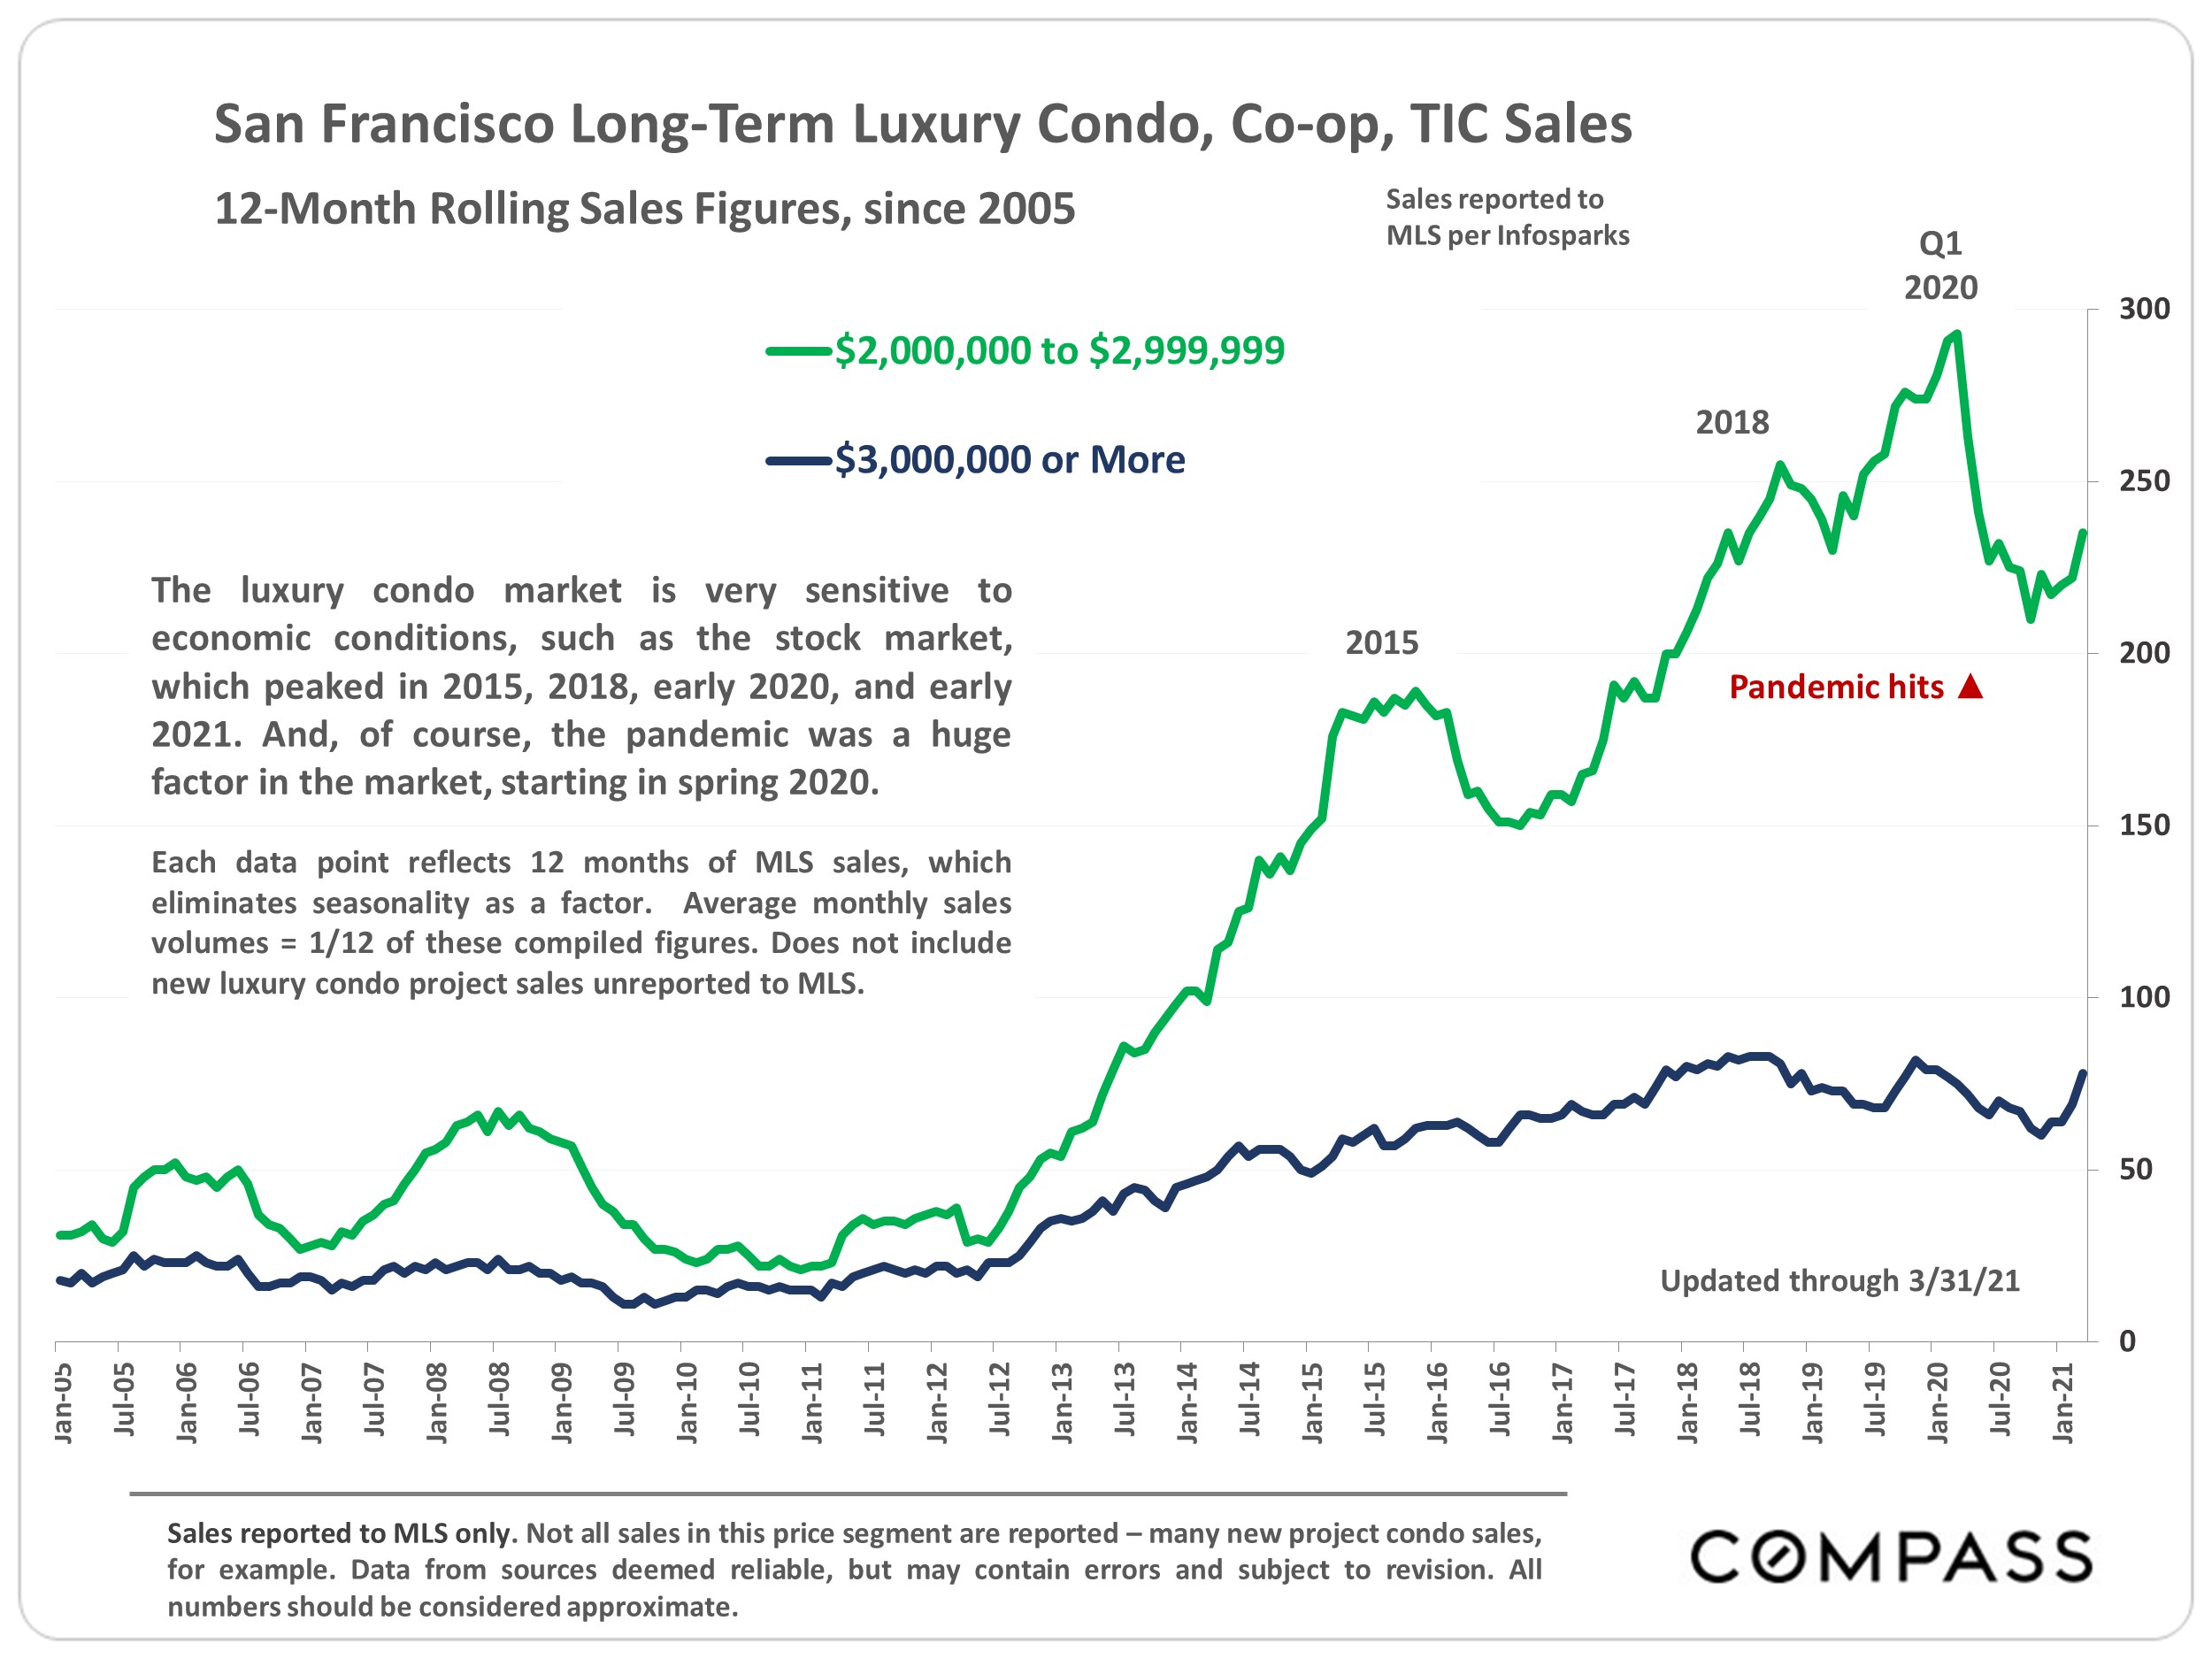
Chart of San Francisco luxury condo sales by price range, 2005–2021, with a pandemic marker and sales peaks.

Work With Us

Susie is currently the proud founder and owner of Susie Lee Group, a team comprised of talented Realtors and professionals that specialize in guiding real estate transactions within the San Francisco and Bay Area market.

Contact Us