Menu
Search
San Francisco hillside garden overlooks the bay, city buildings, and distant Marin hills.

market report

March 2021 | San Francisco | Market Update

12/7/21  |  Susie Lee

San Francisco Real Estate Market Accelerates & Continues To Outperform Expectations For Spring

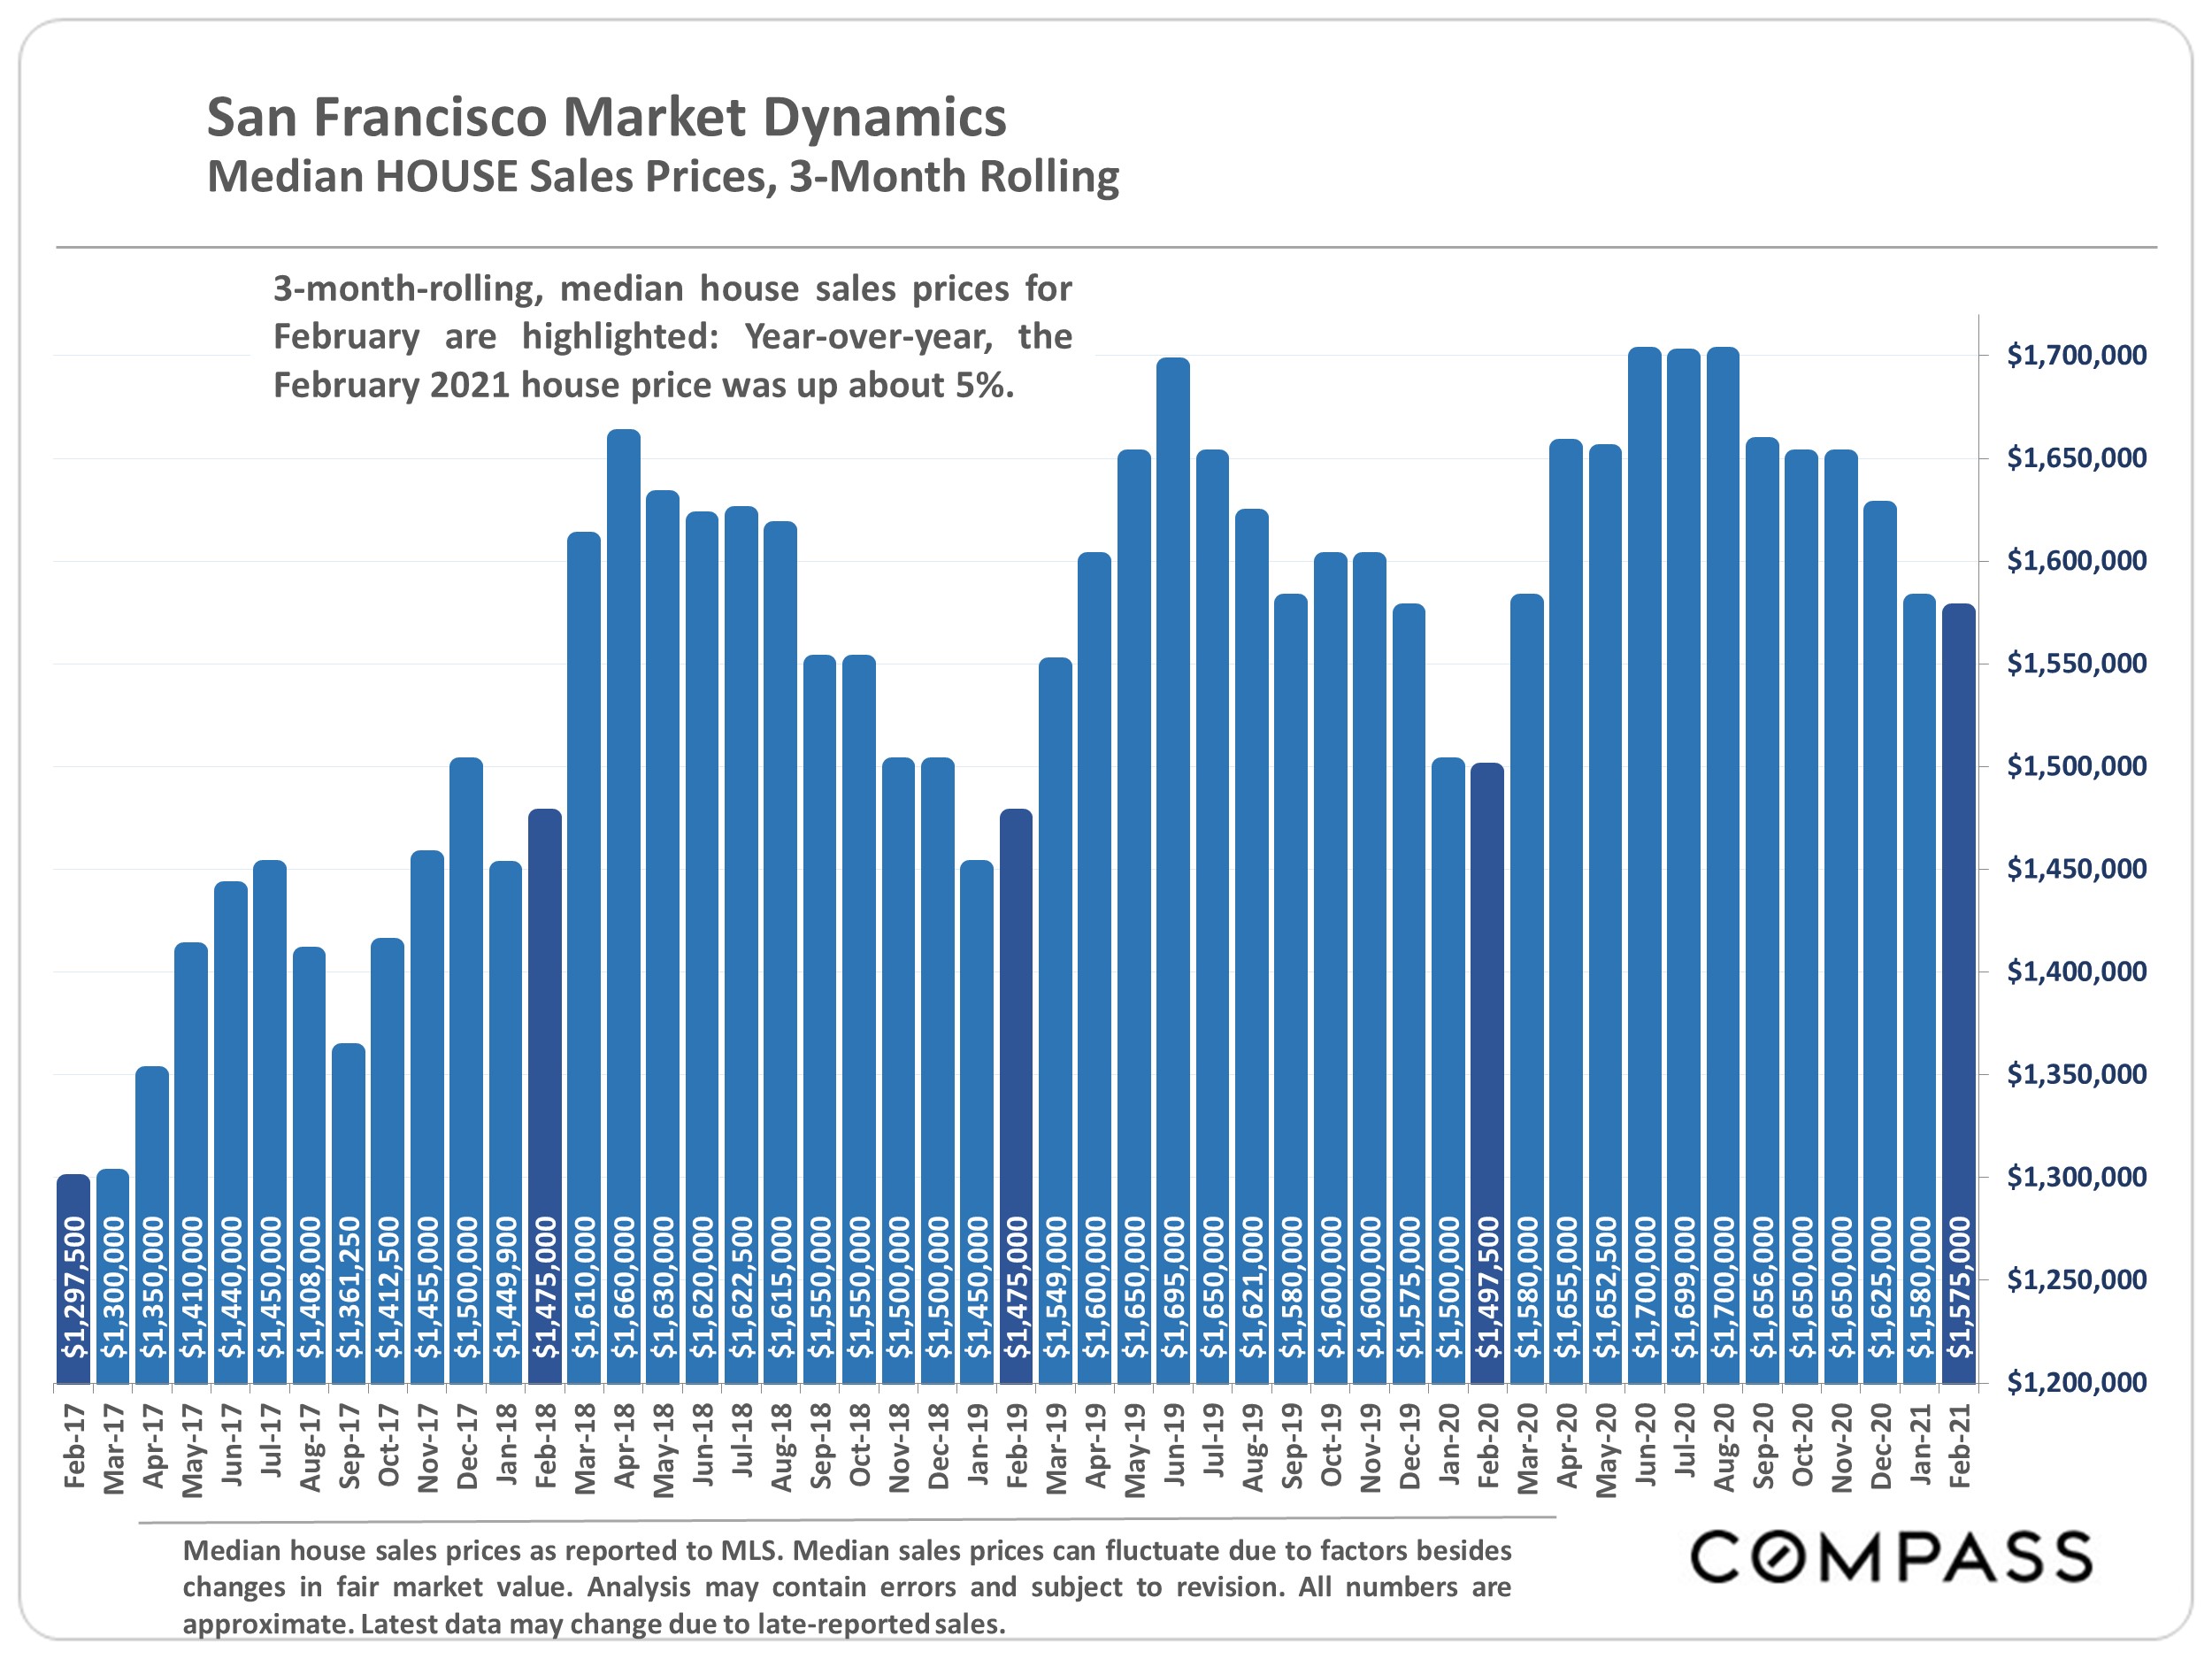
Bar chart of San Francisco median house sale prices, February 2017–February 2021, with February 2021 highlighted at $1,575,000.

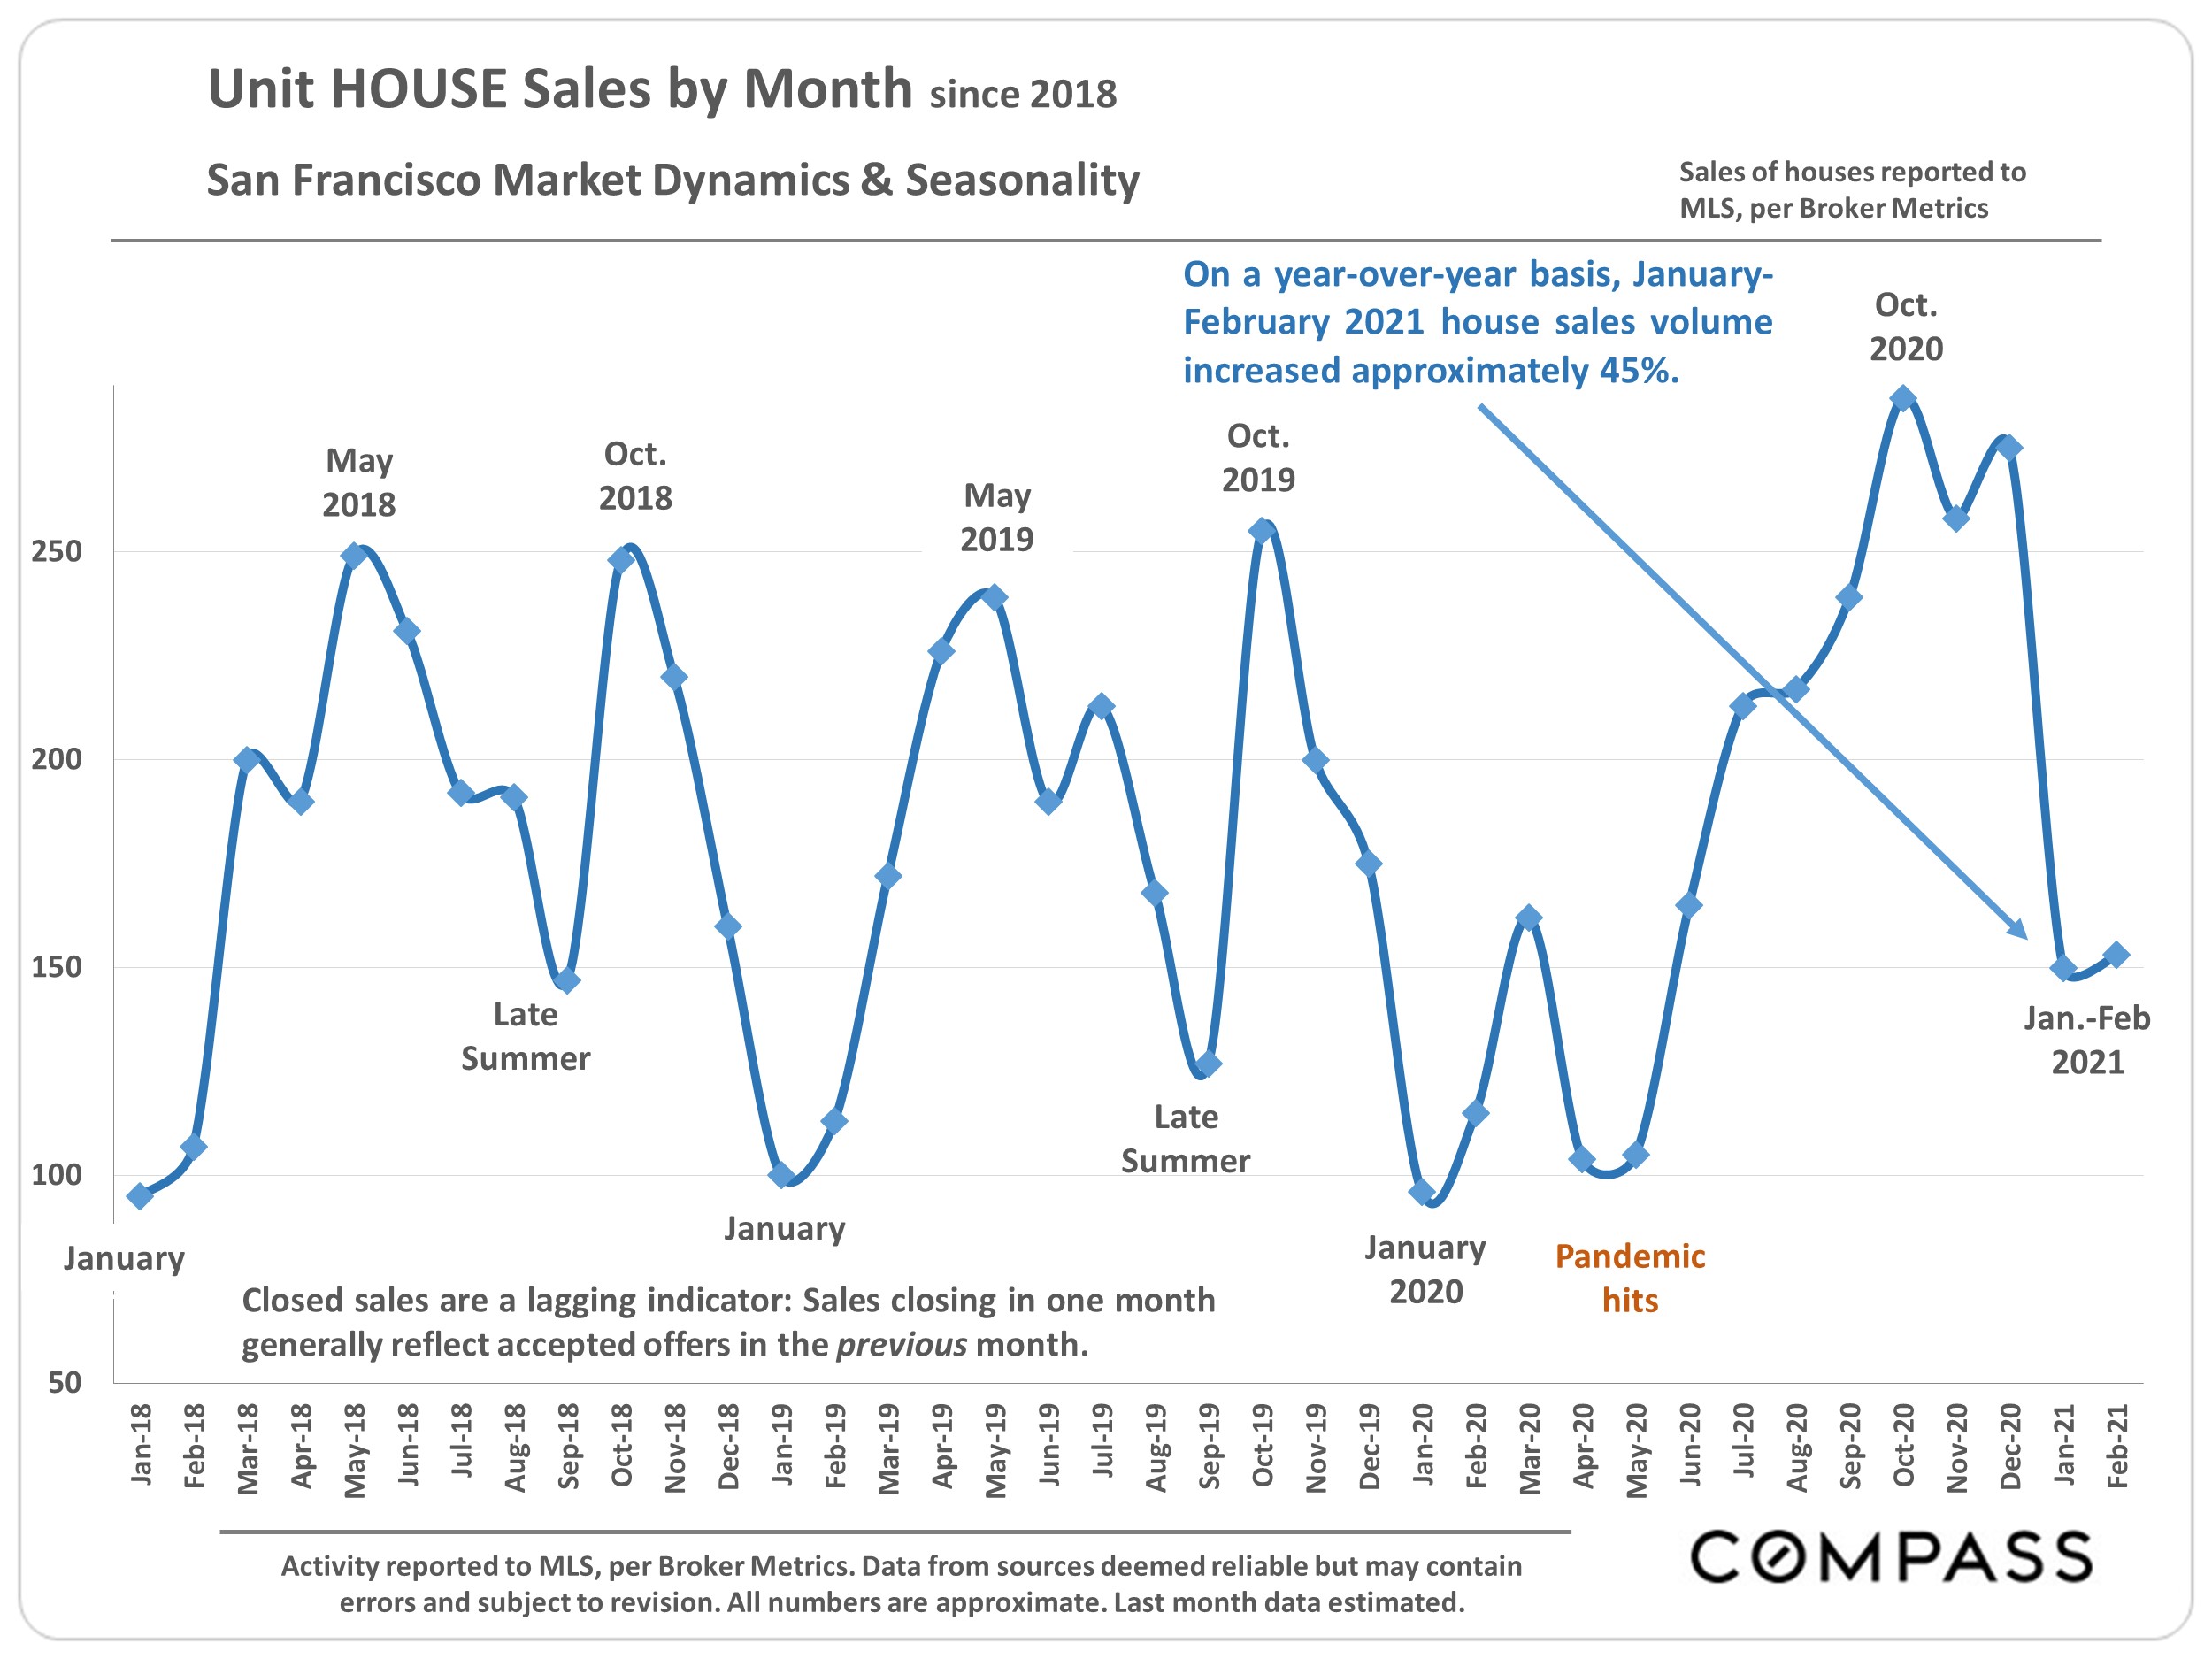
Chart of monthly San Francisco house sales, 2018–February 2021, with seasonal peaks and pandemic-era changes.

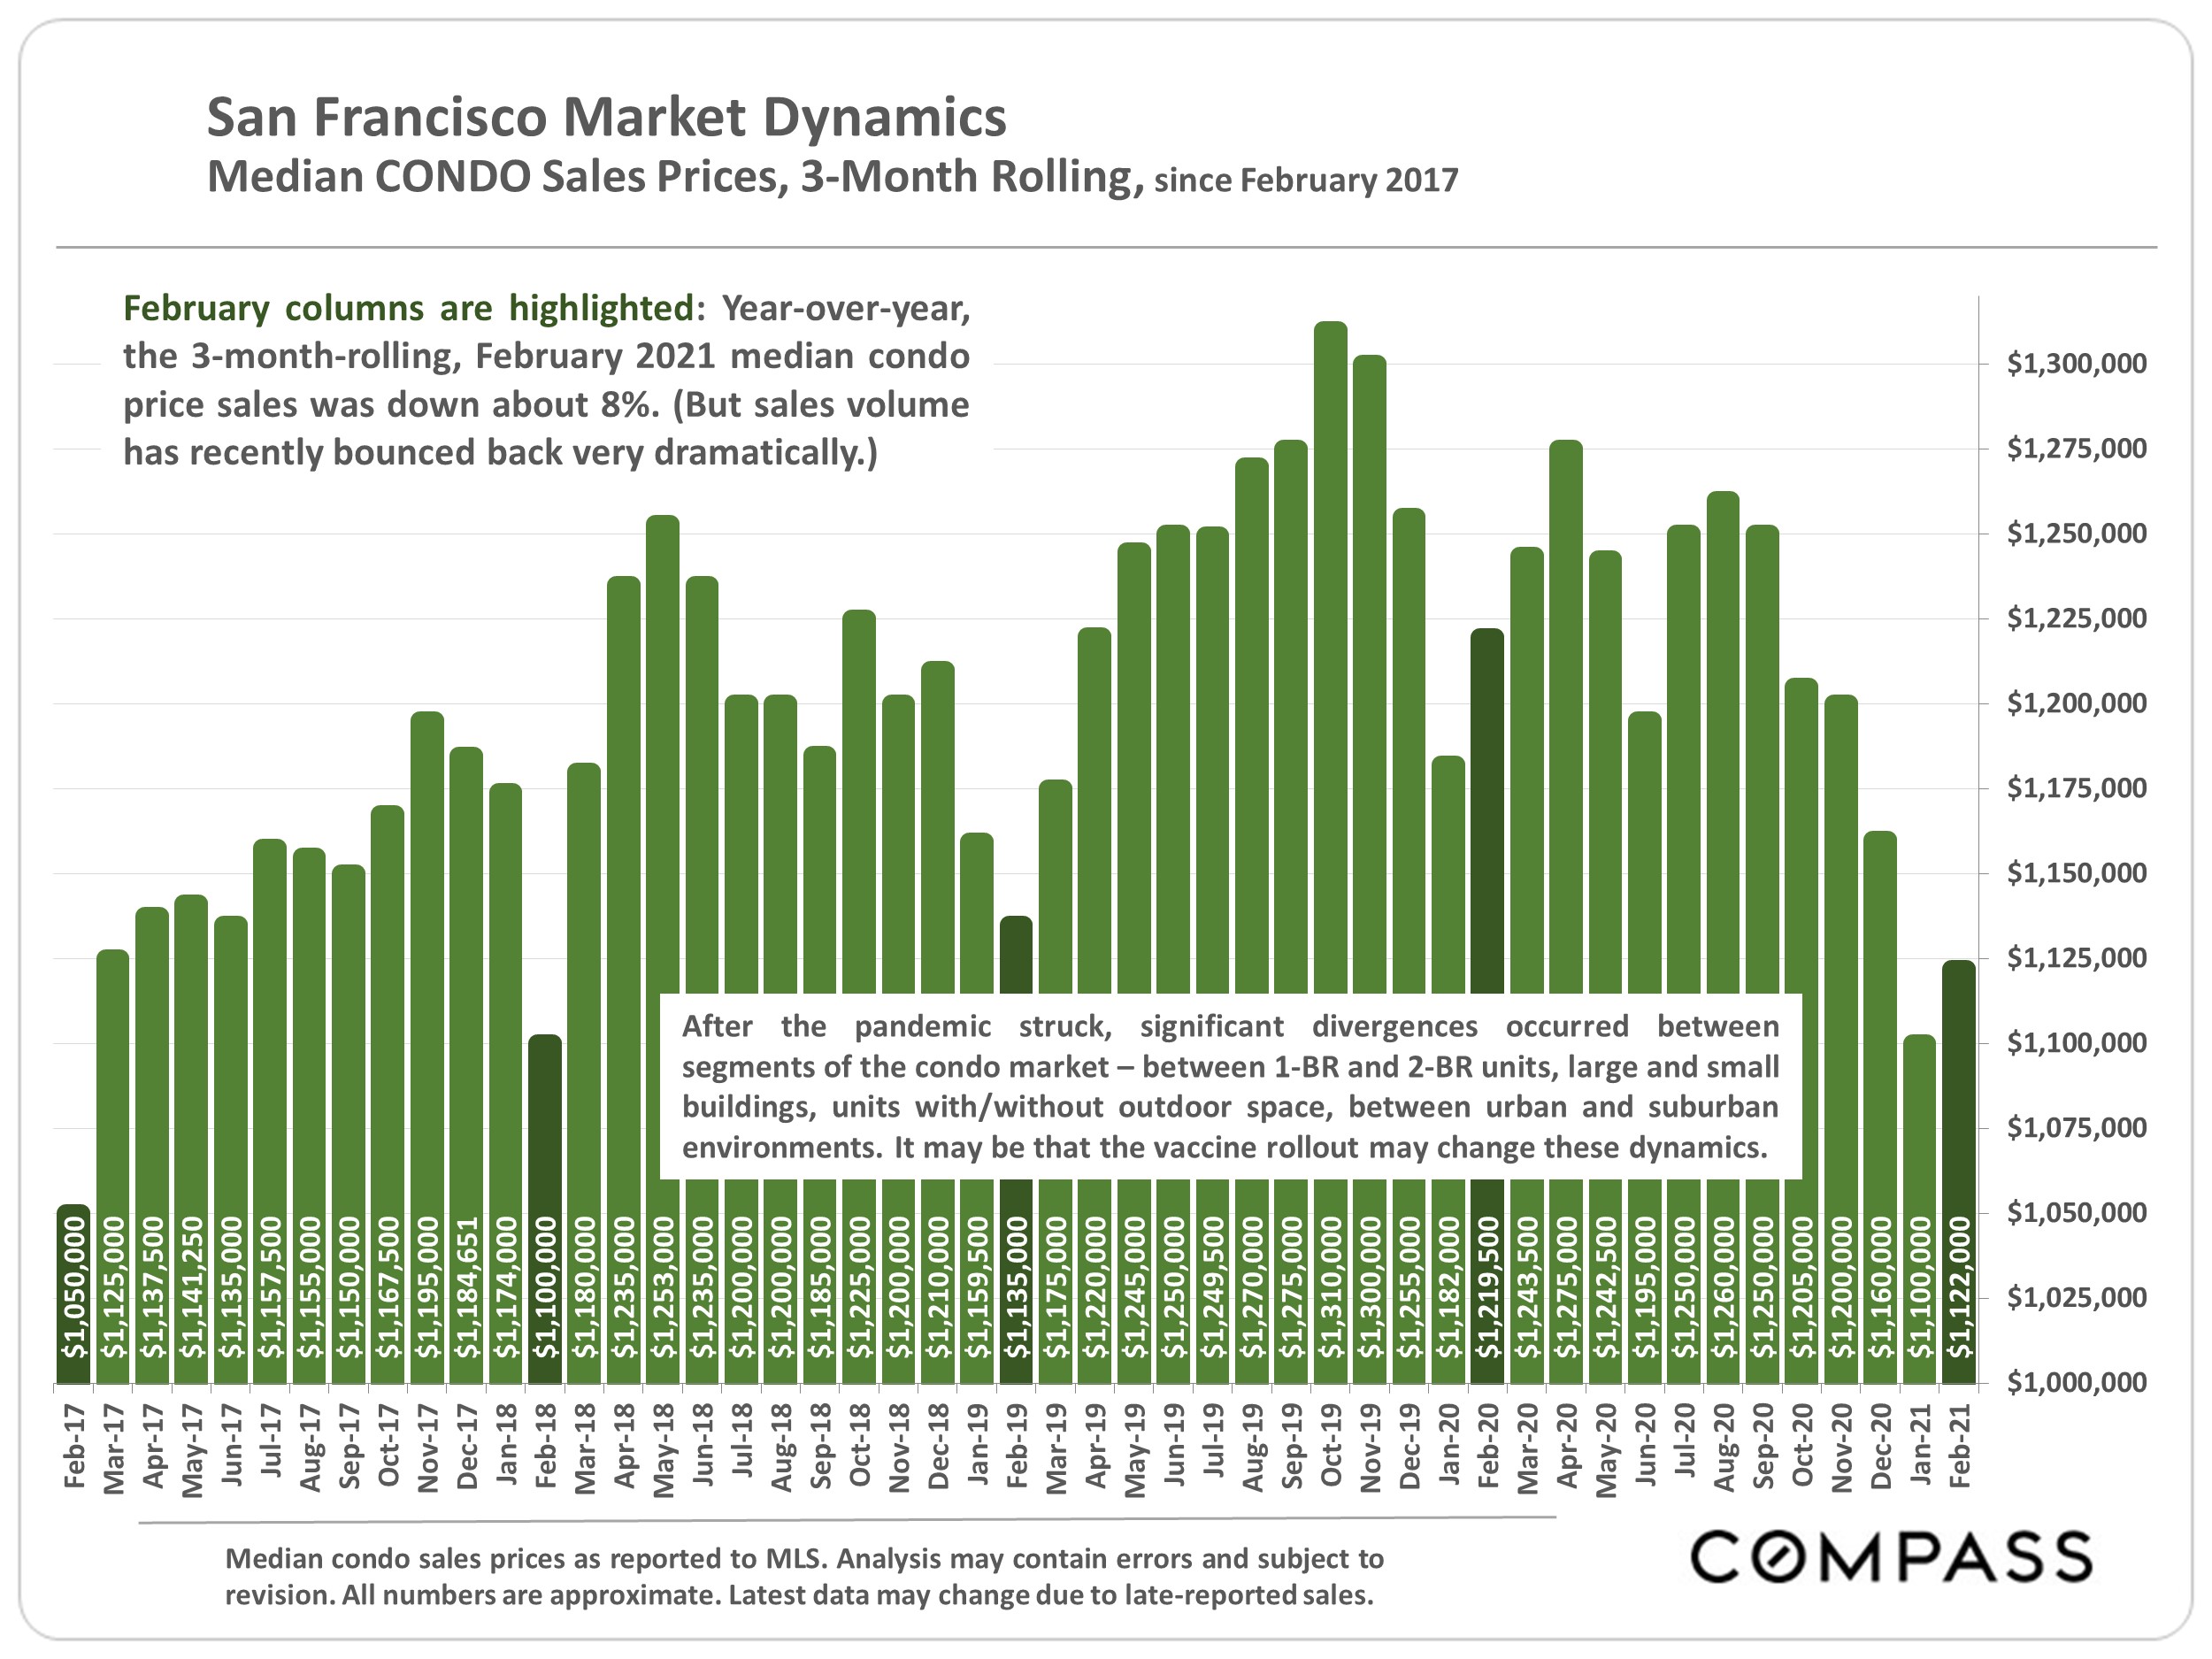
Chart of San Francisco median condo sale prices from February 2017 to February 2021, with February bars highlighted.

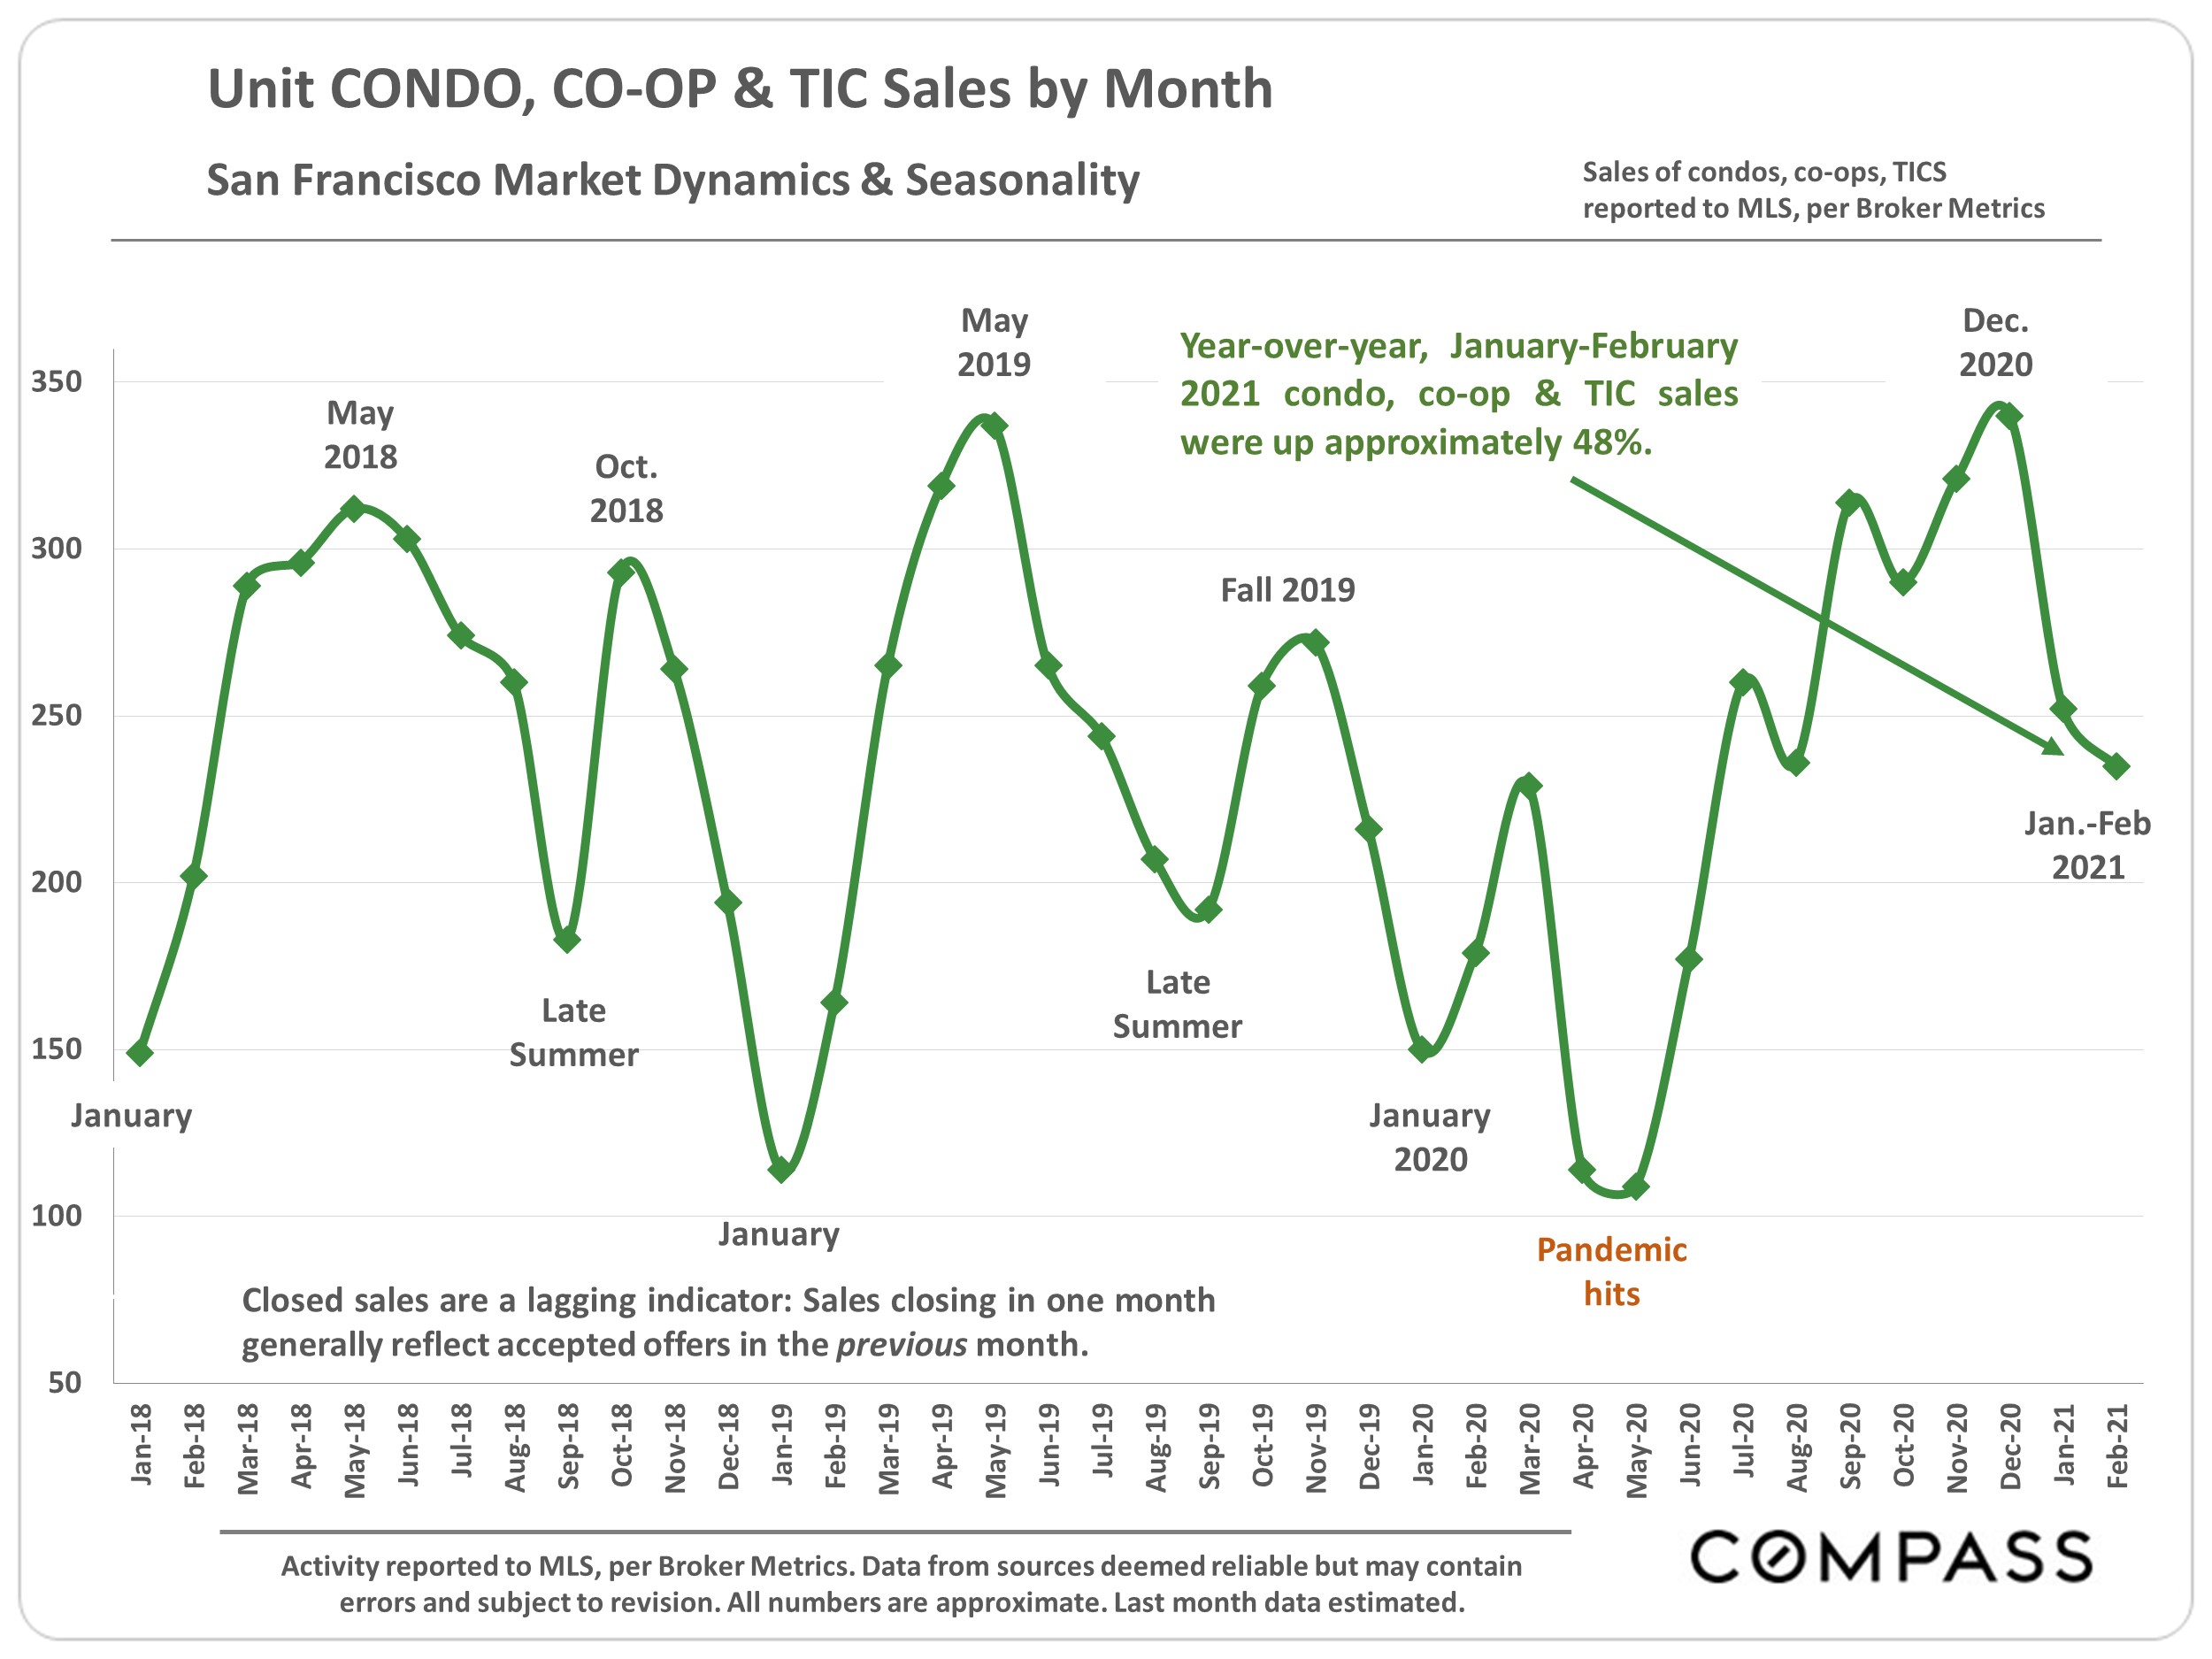
Line chart of San Francisco condo, co-op and TIC monthly sales, January 2018–February 2021.

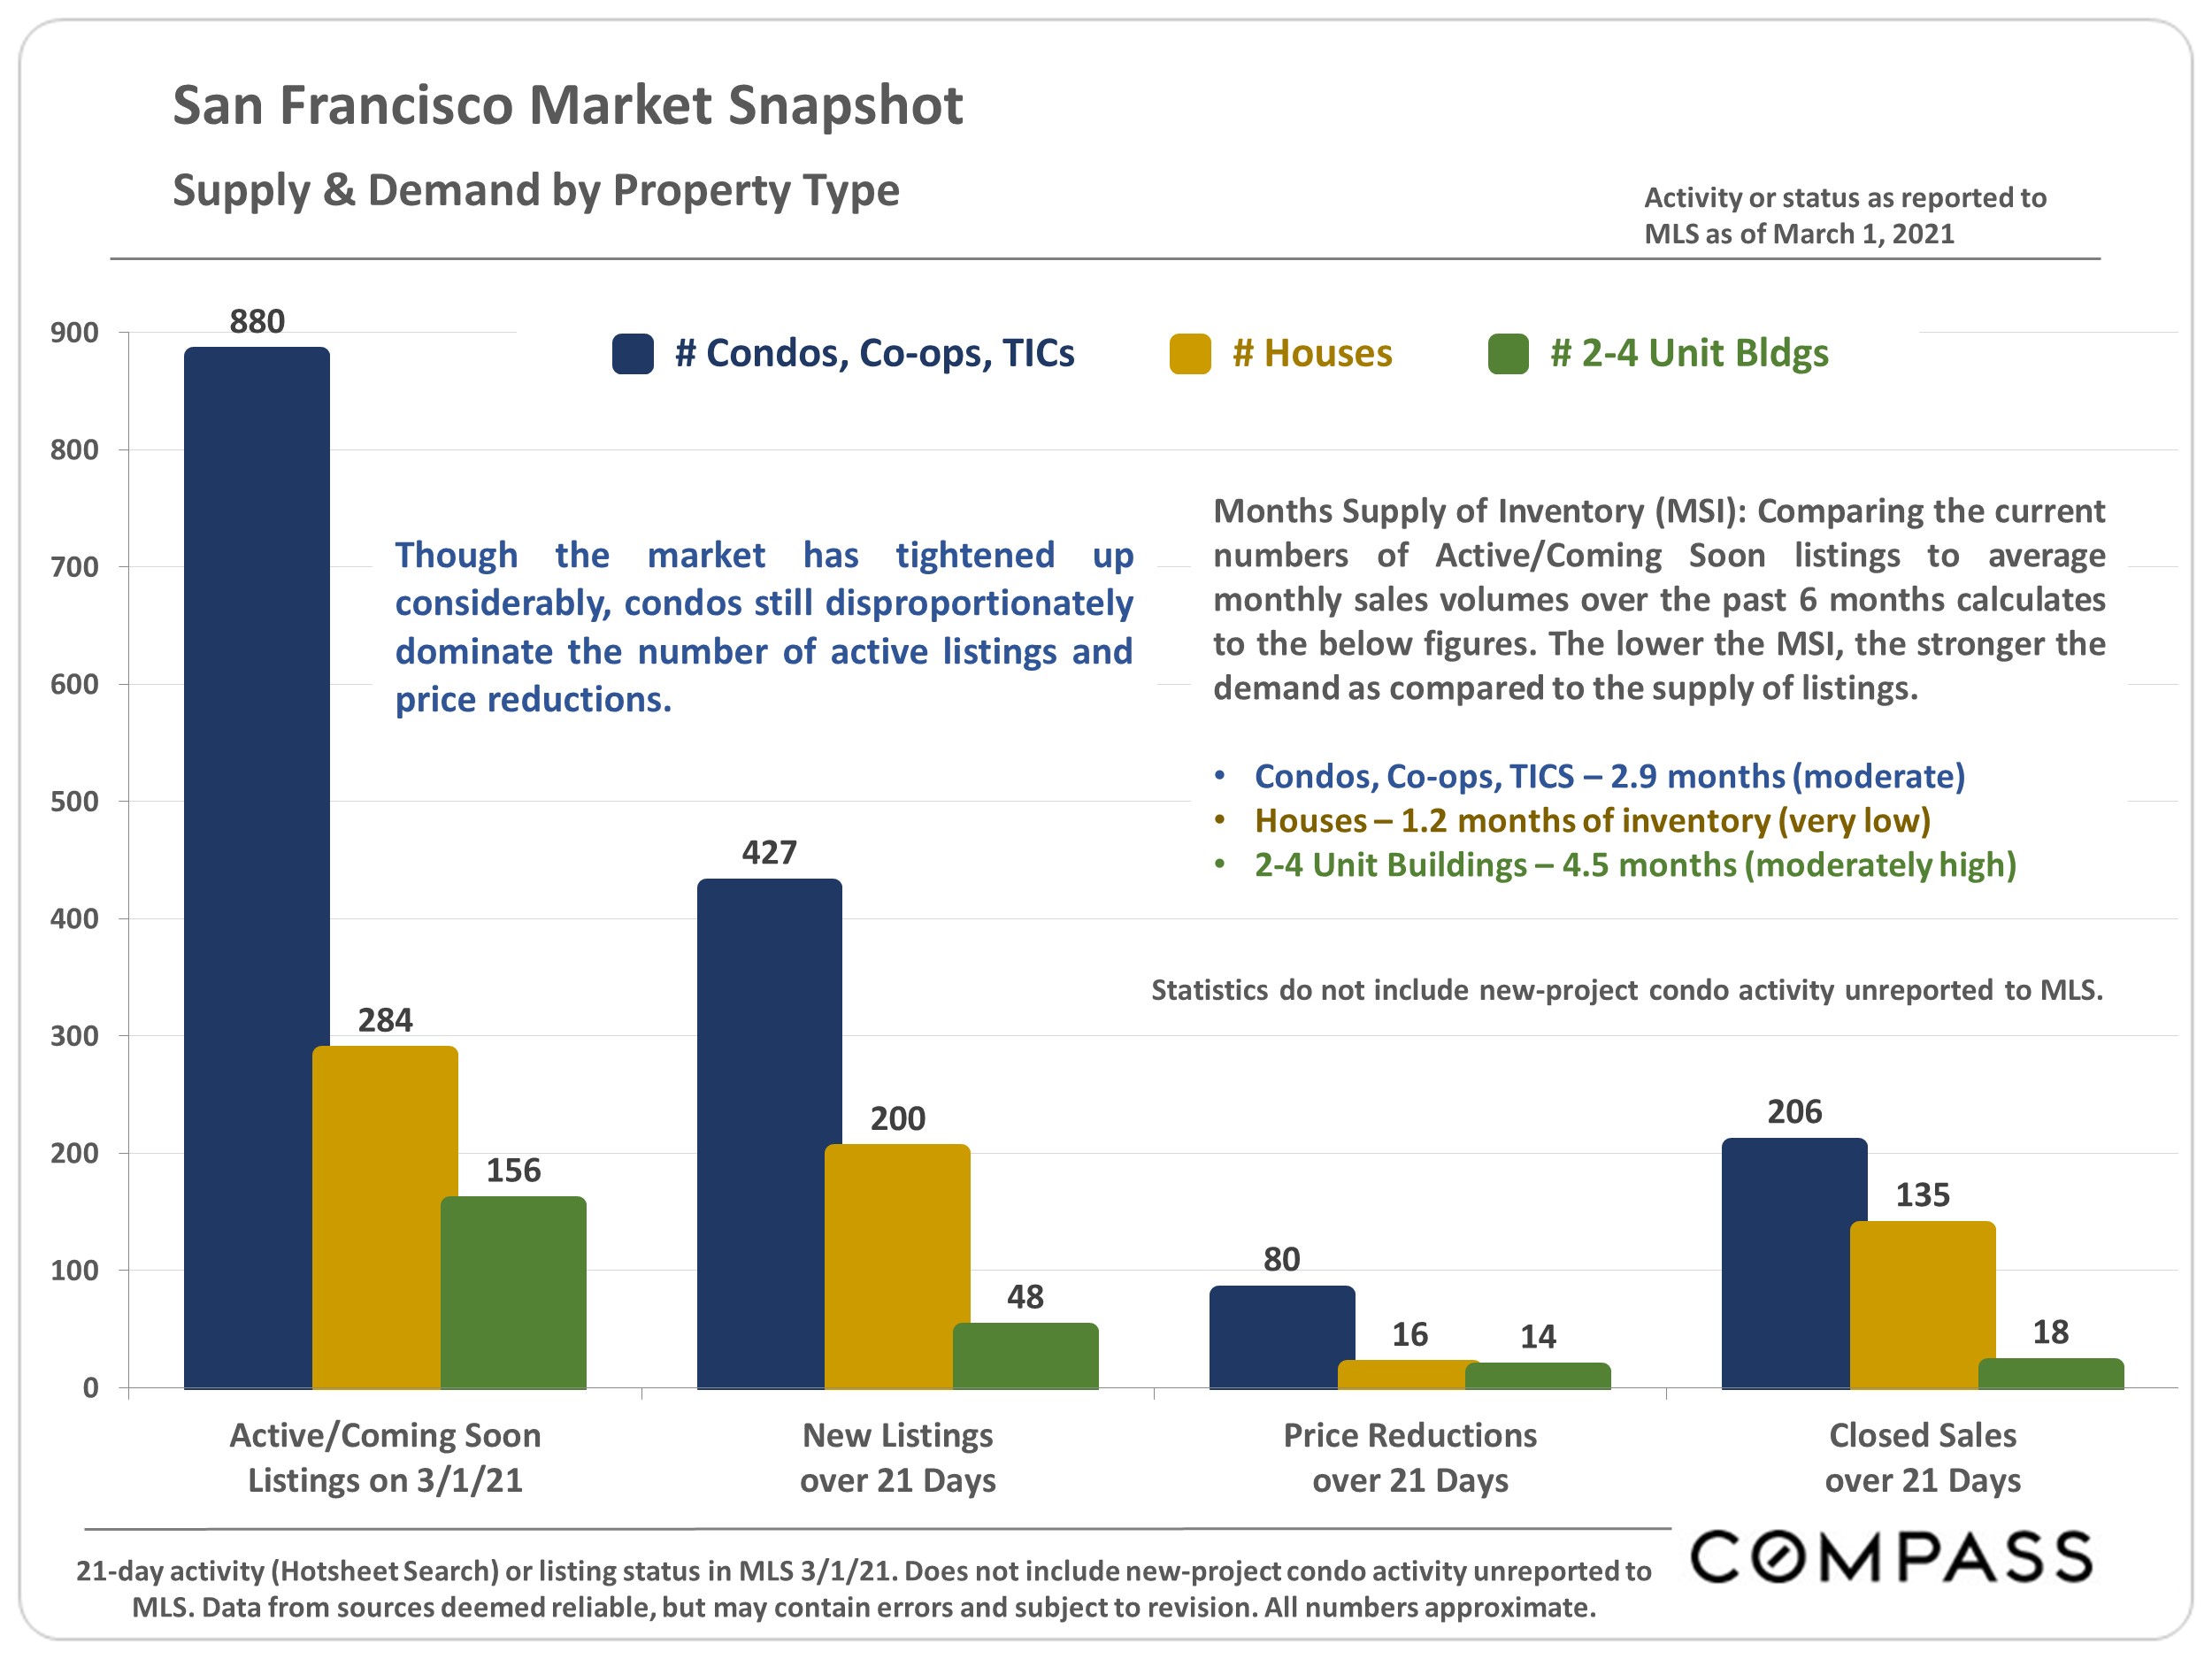
San Francisco real estate market chart comparing listings, price reductions, and sales by property type in March 2021.

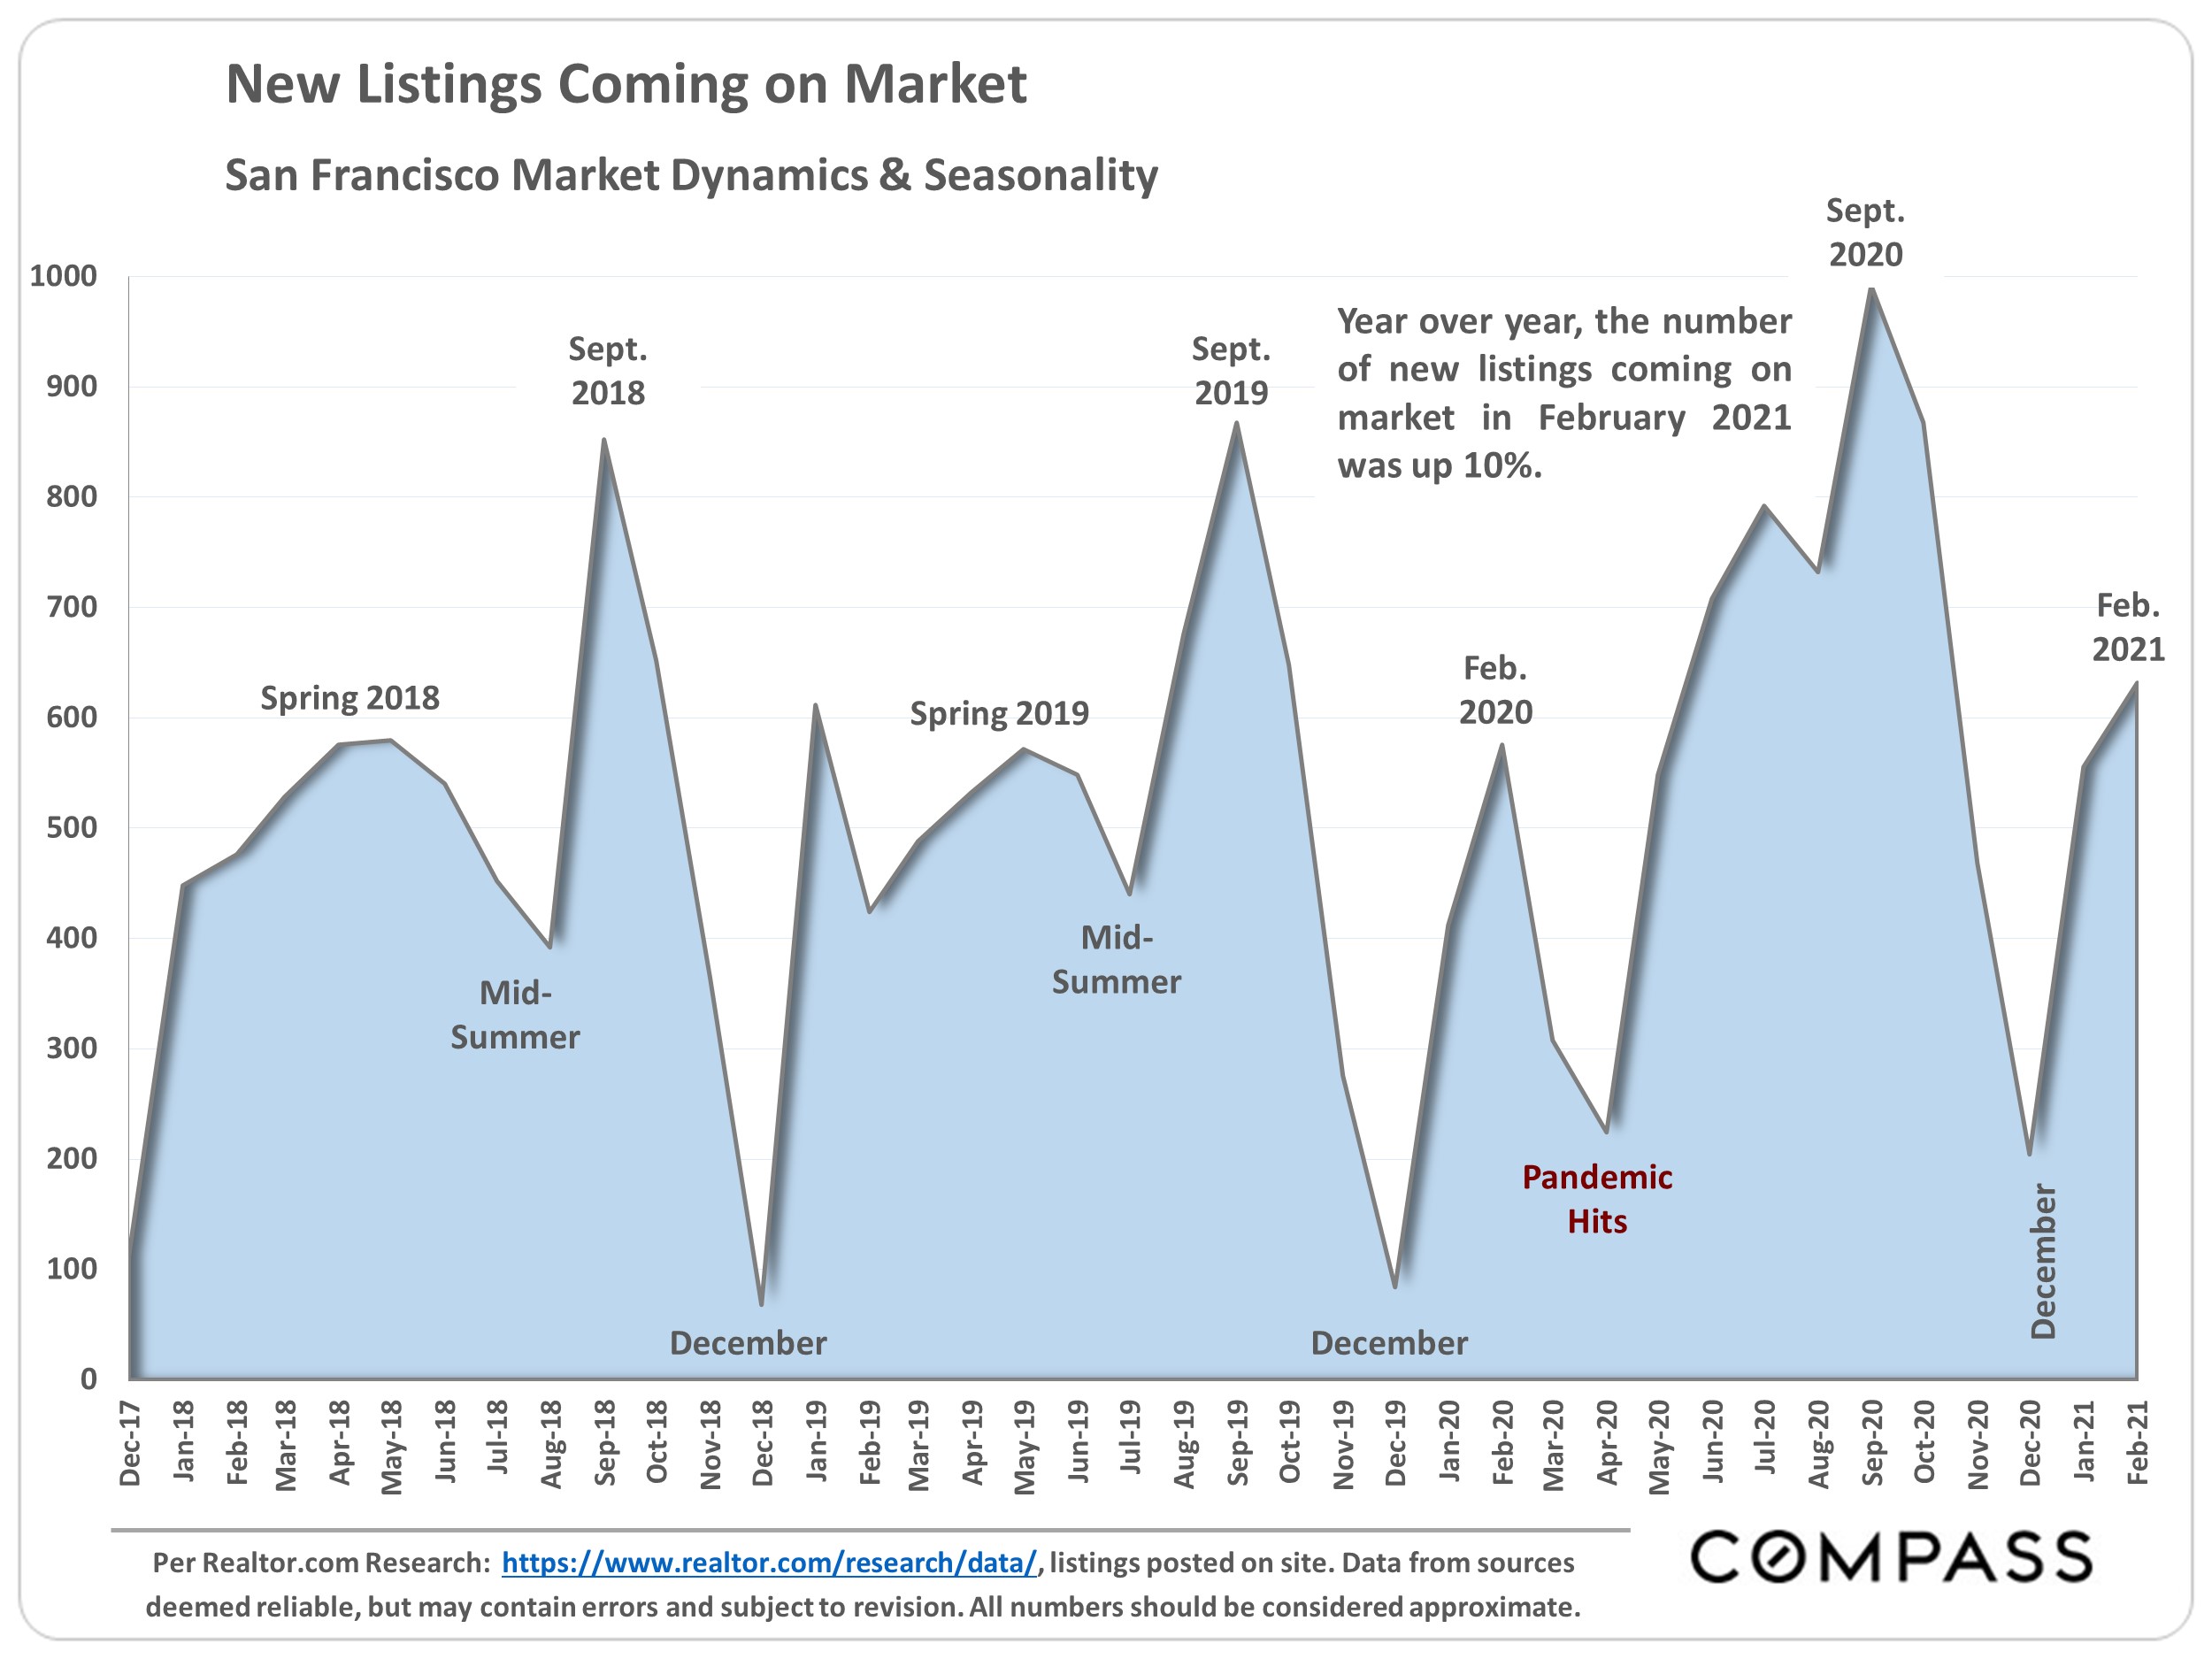
Chart of San Francisco new listings from December 2017 to February 2021, with seasonal peaks and a 10% year-over-year increase.

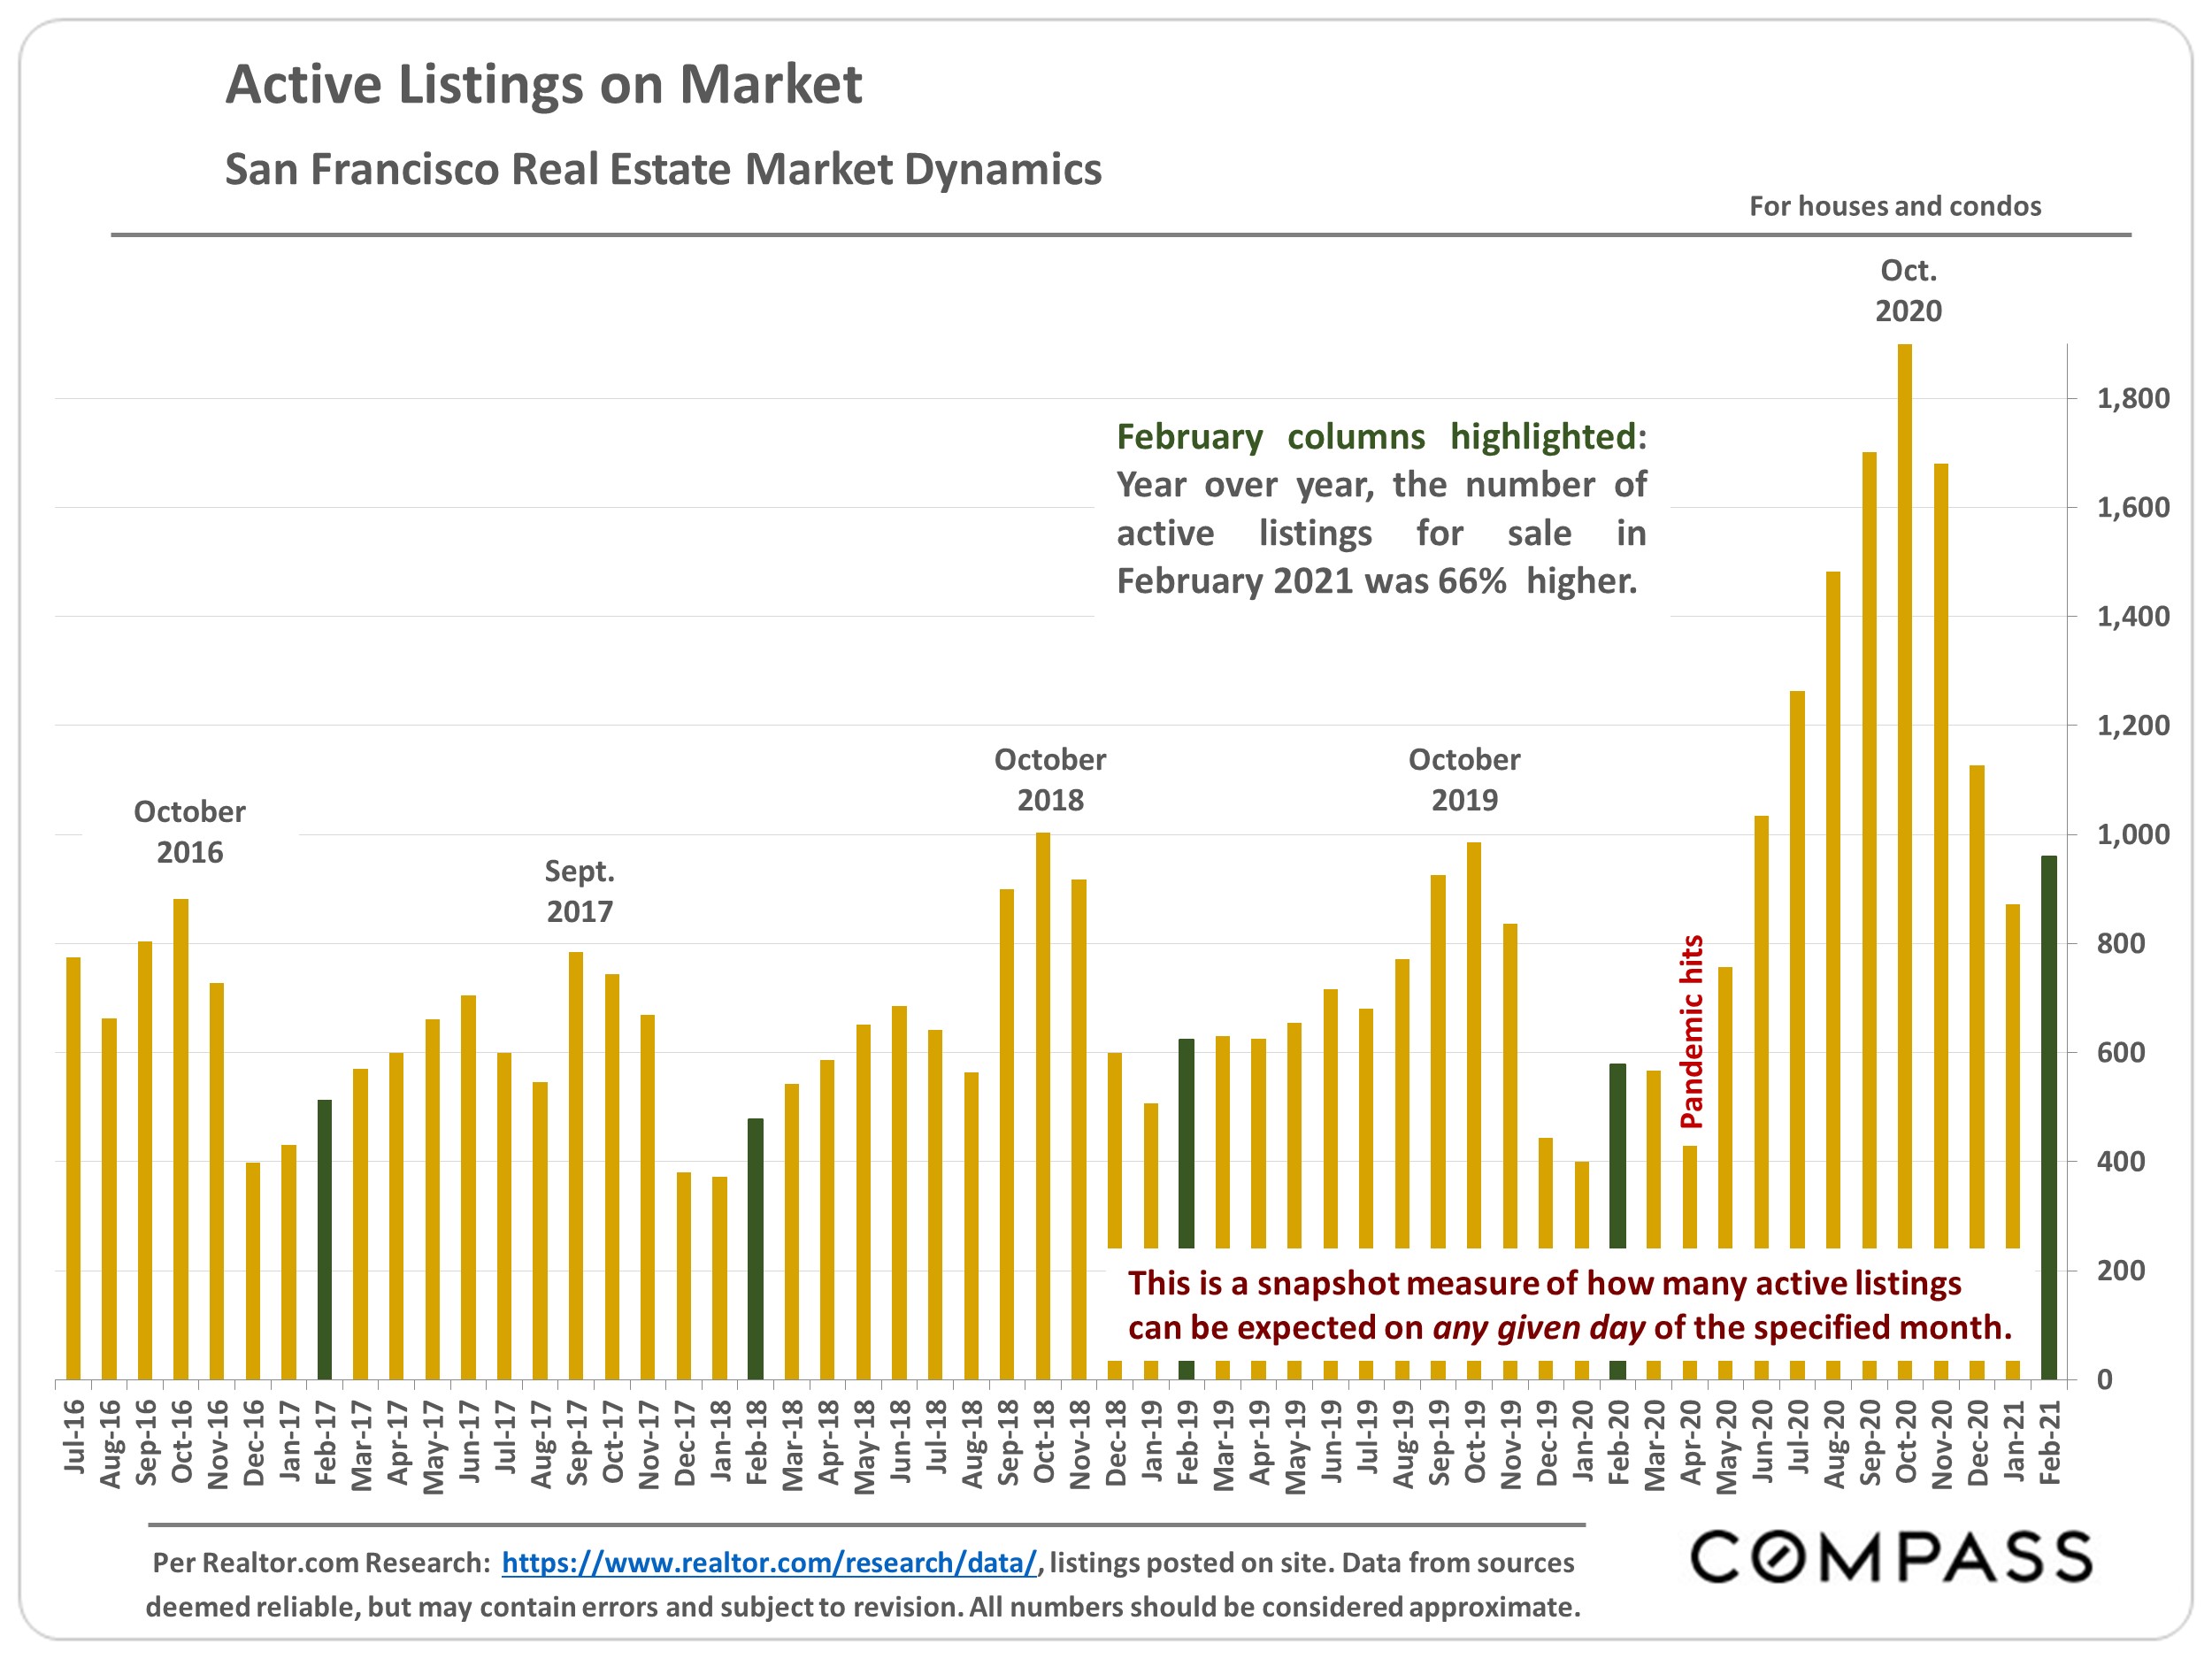
Bar chart of active San Francisco listings, with February 2021 listings 66% higher year over year.

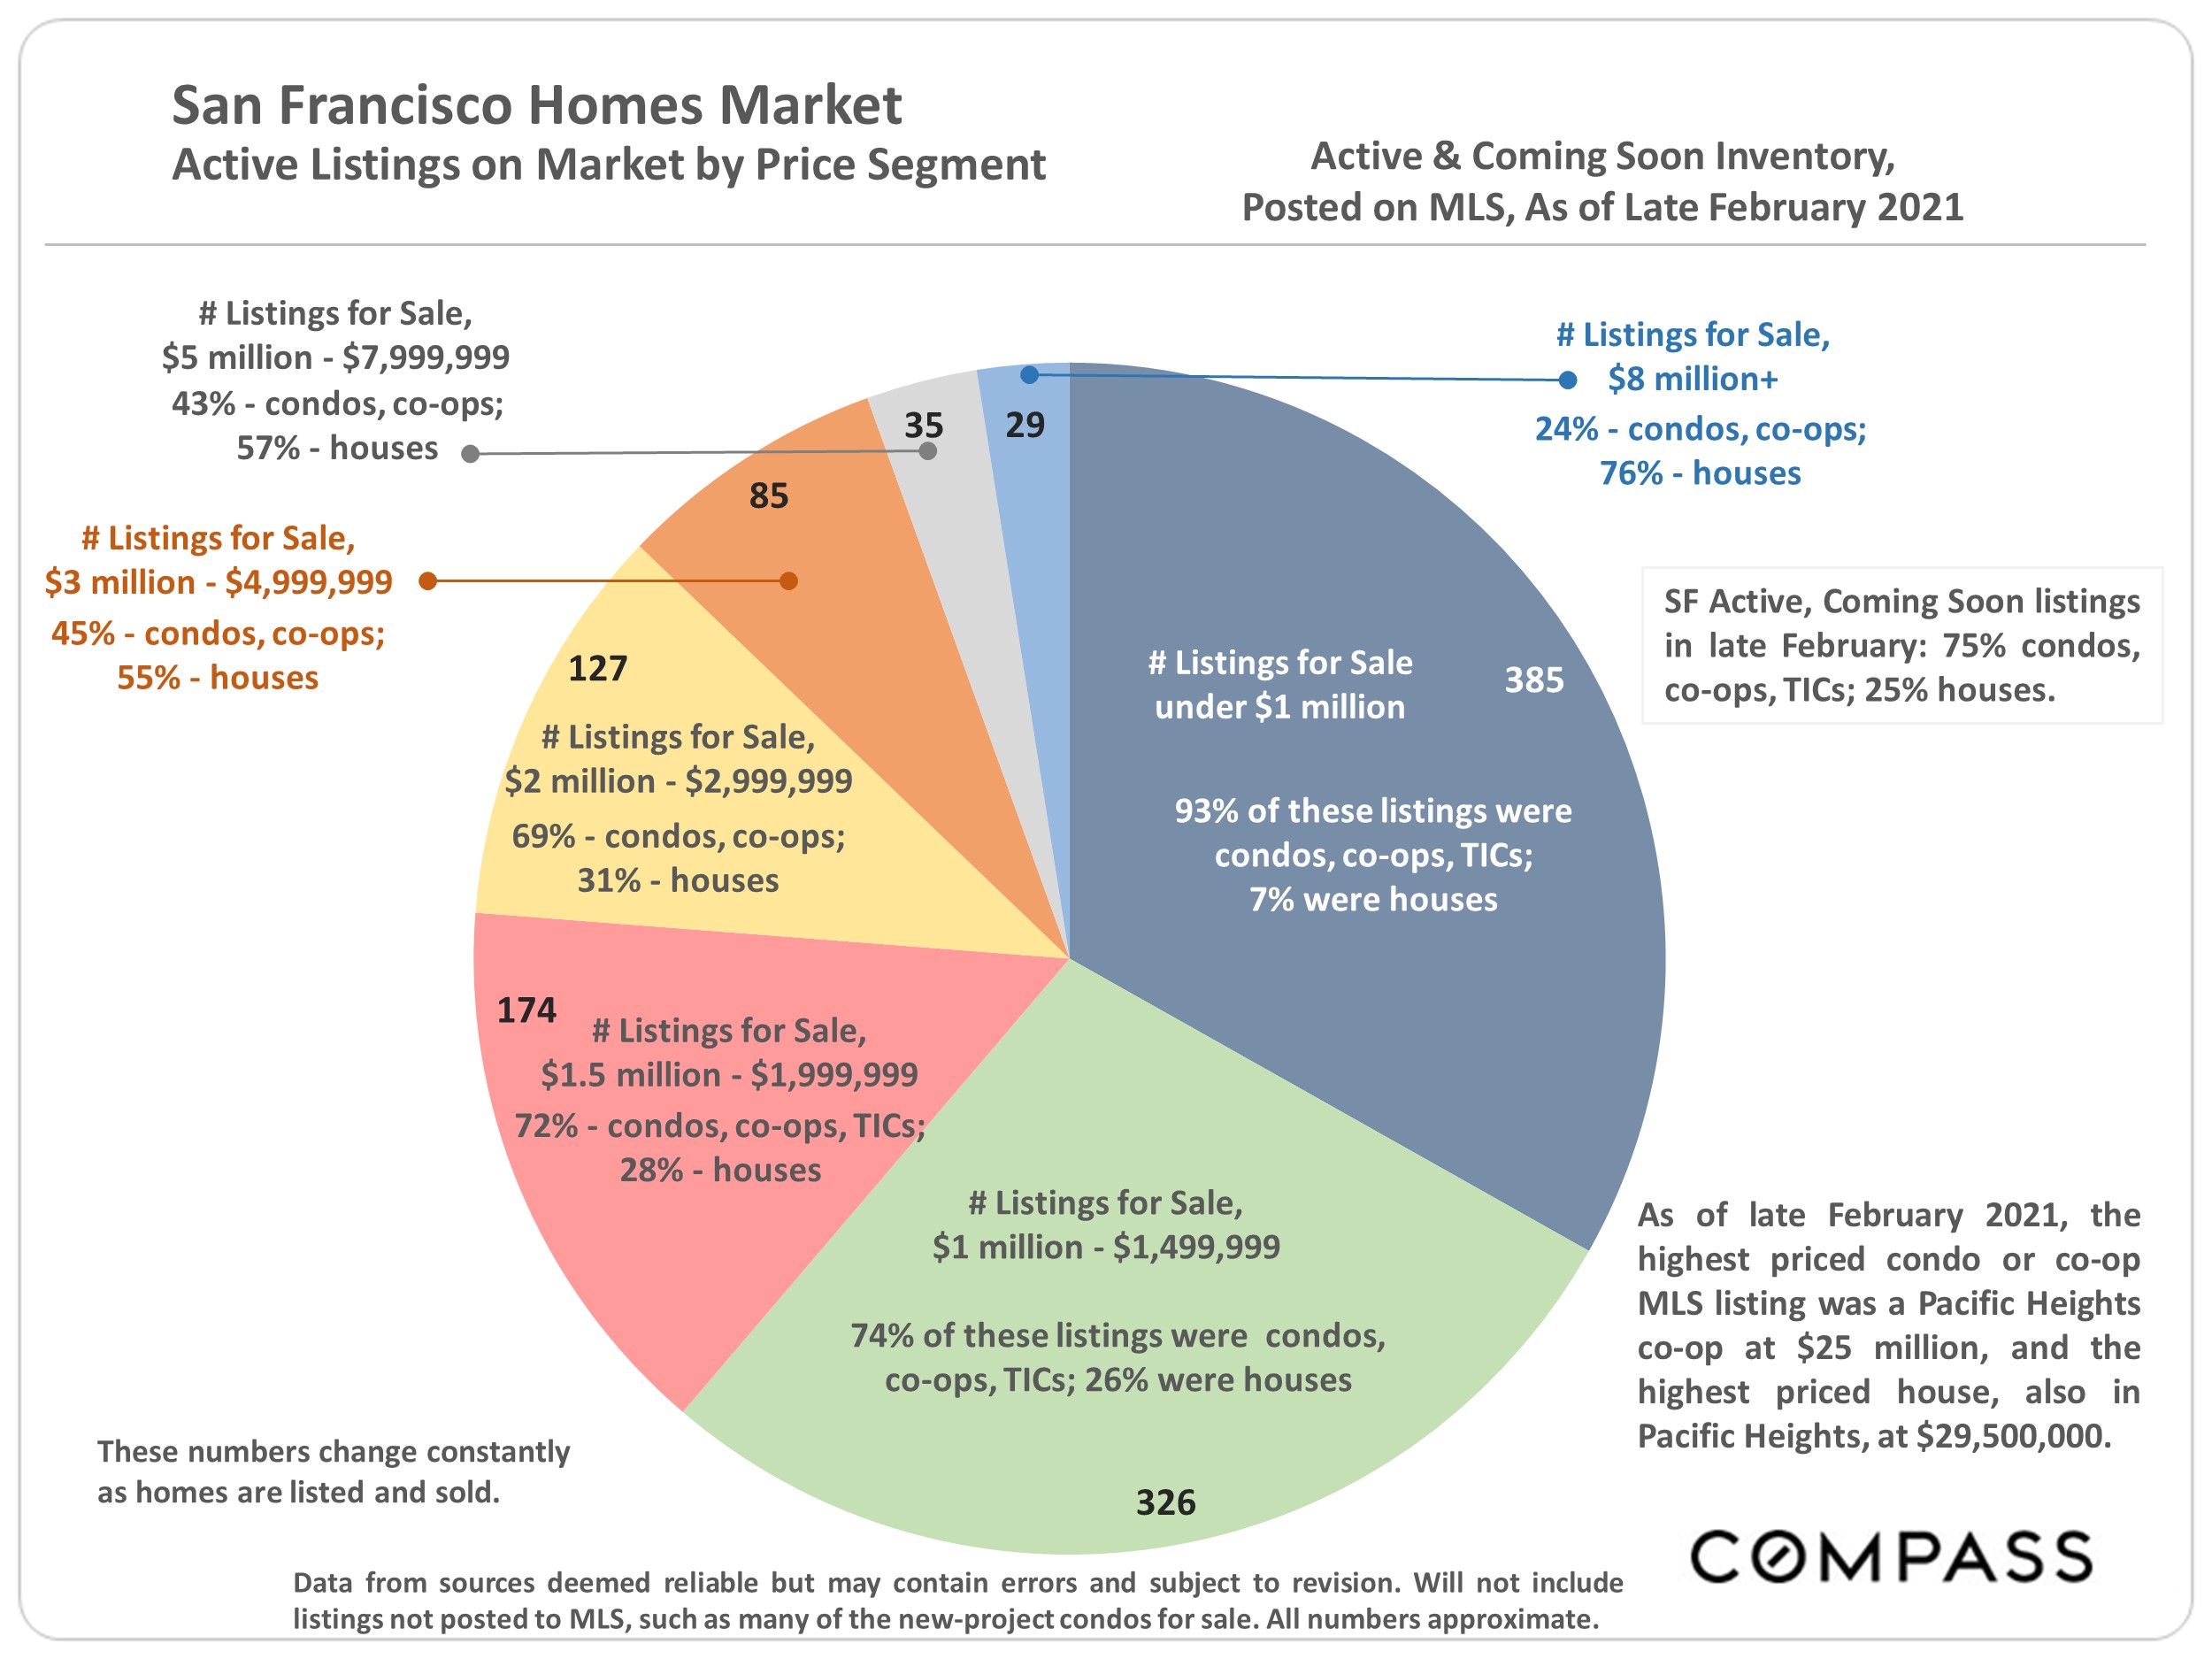
Pie chart of San Francisco active listings by price segment, with counts and property-type breakdowns.

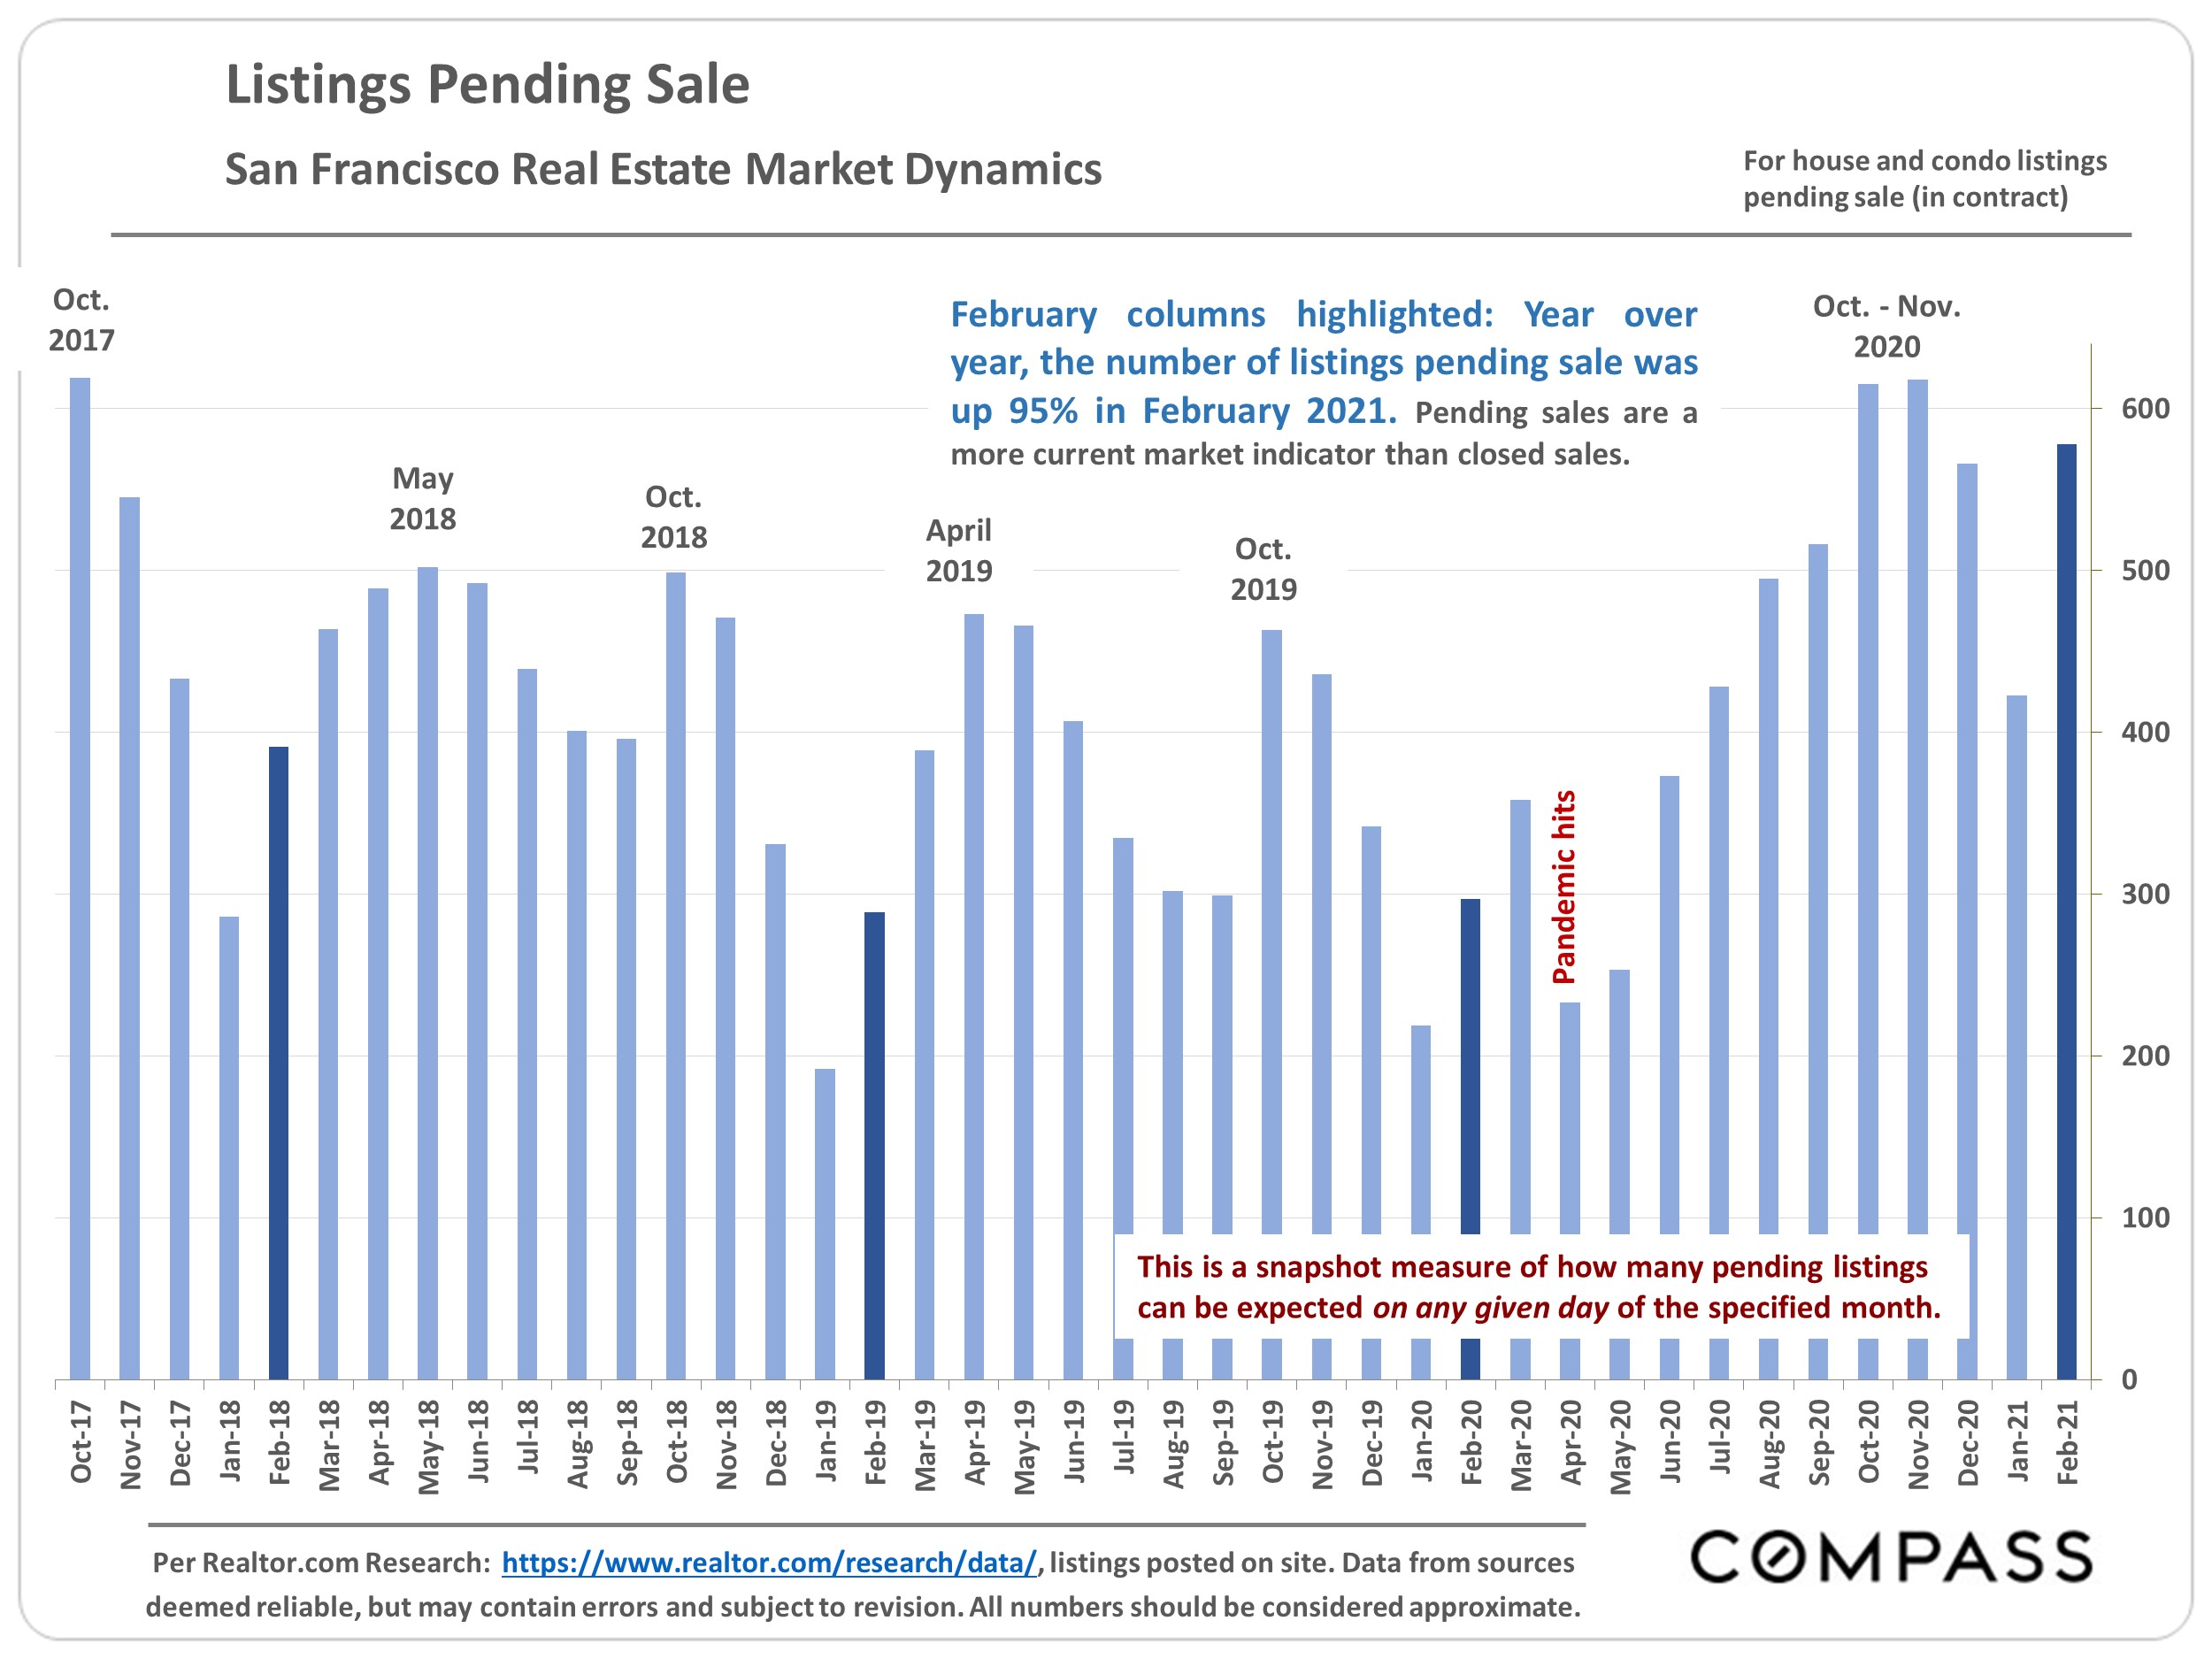
San Francisco pending-sale listings chart, showing monthly counts from October 2017 through February 2021.

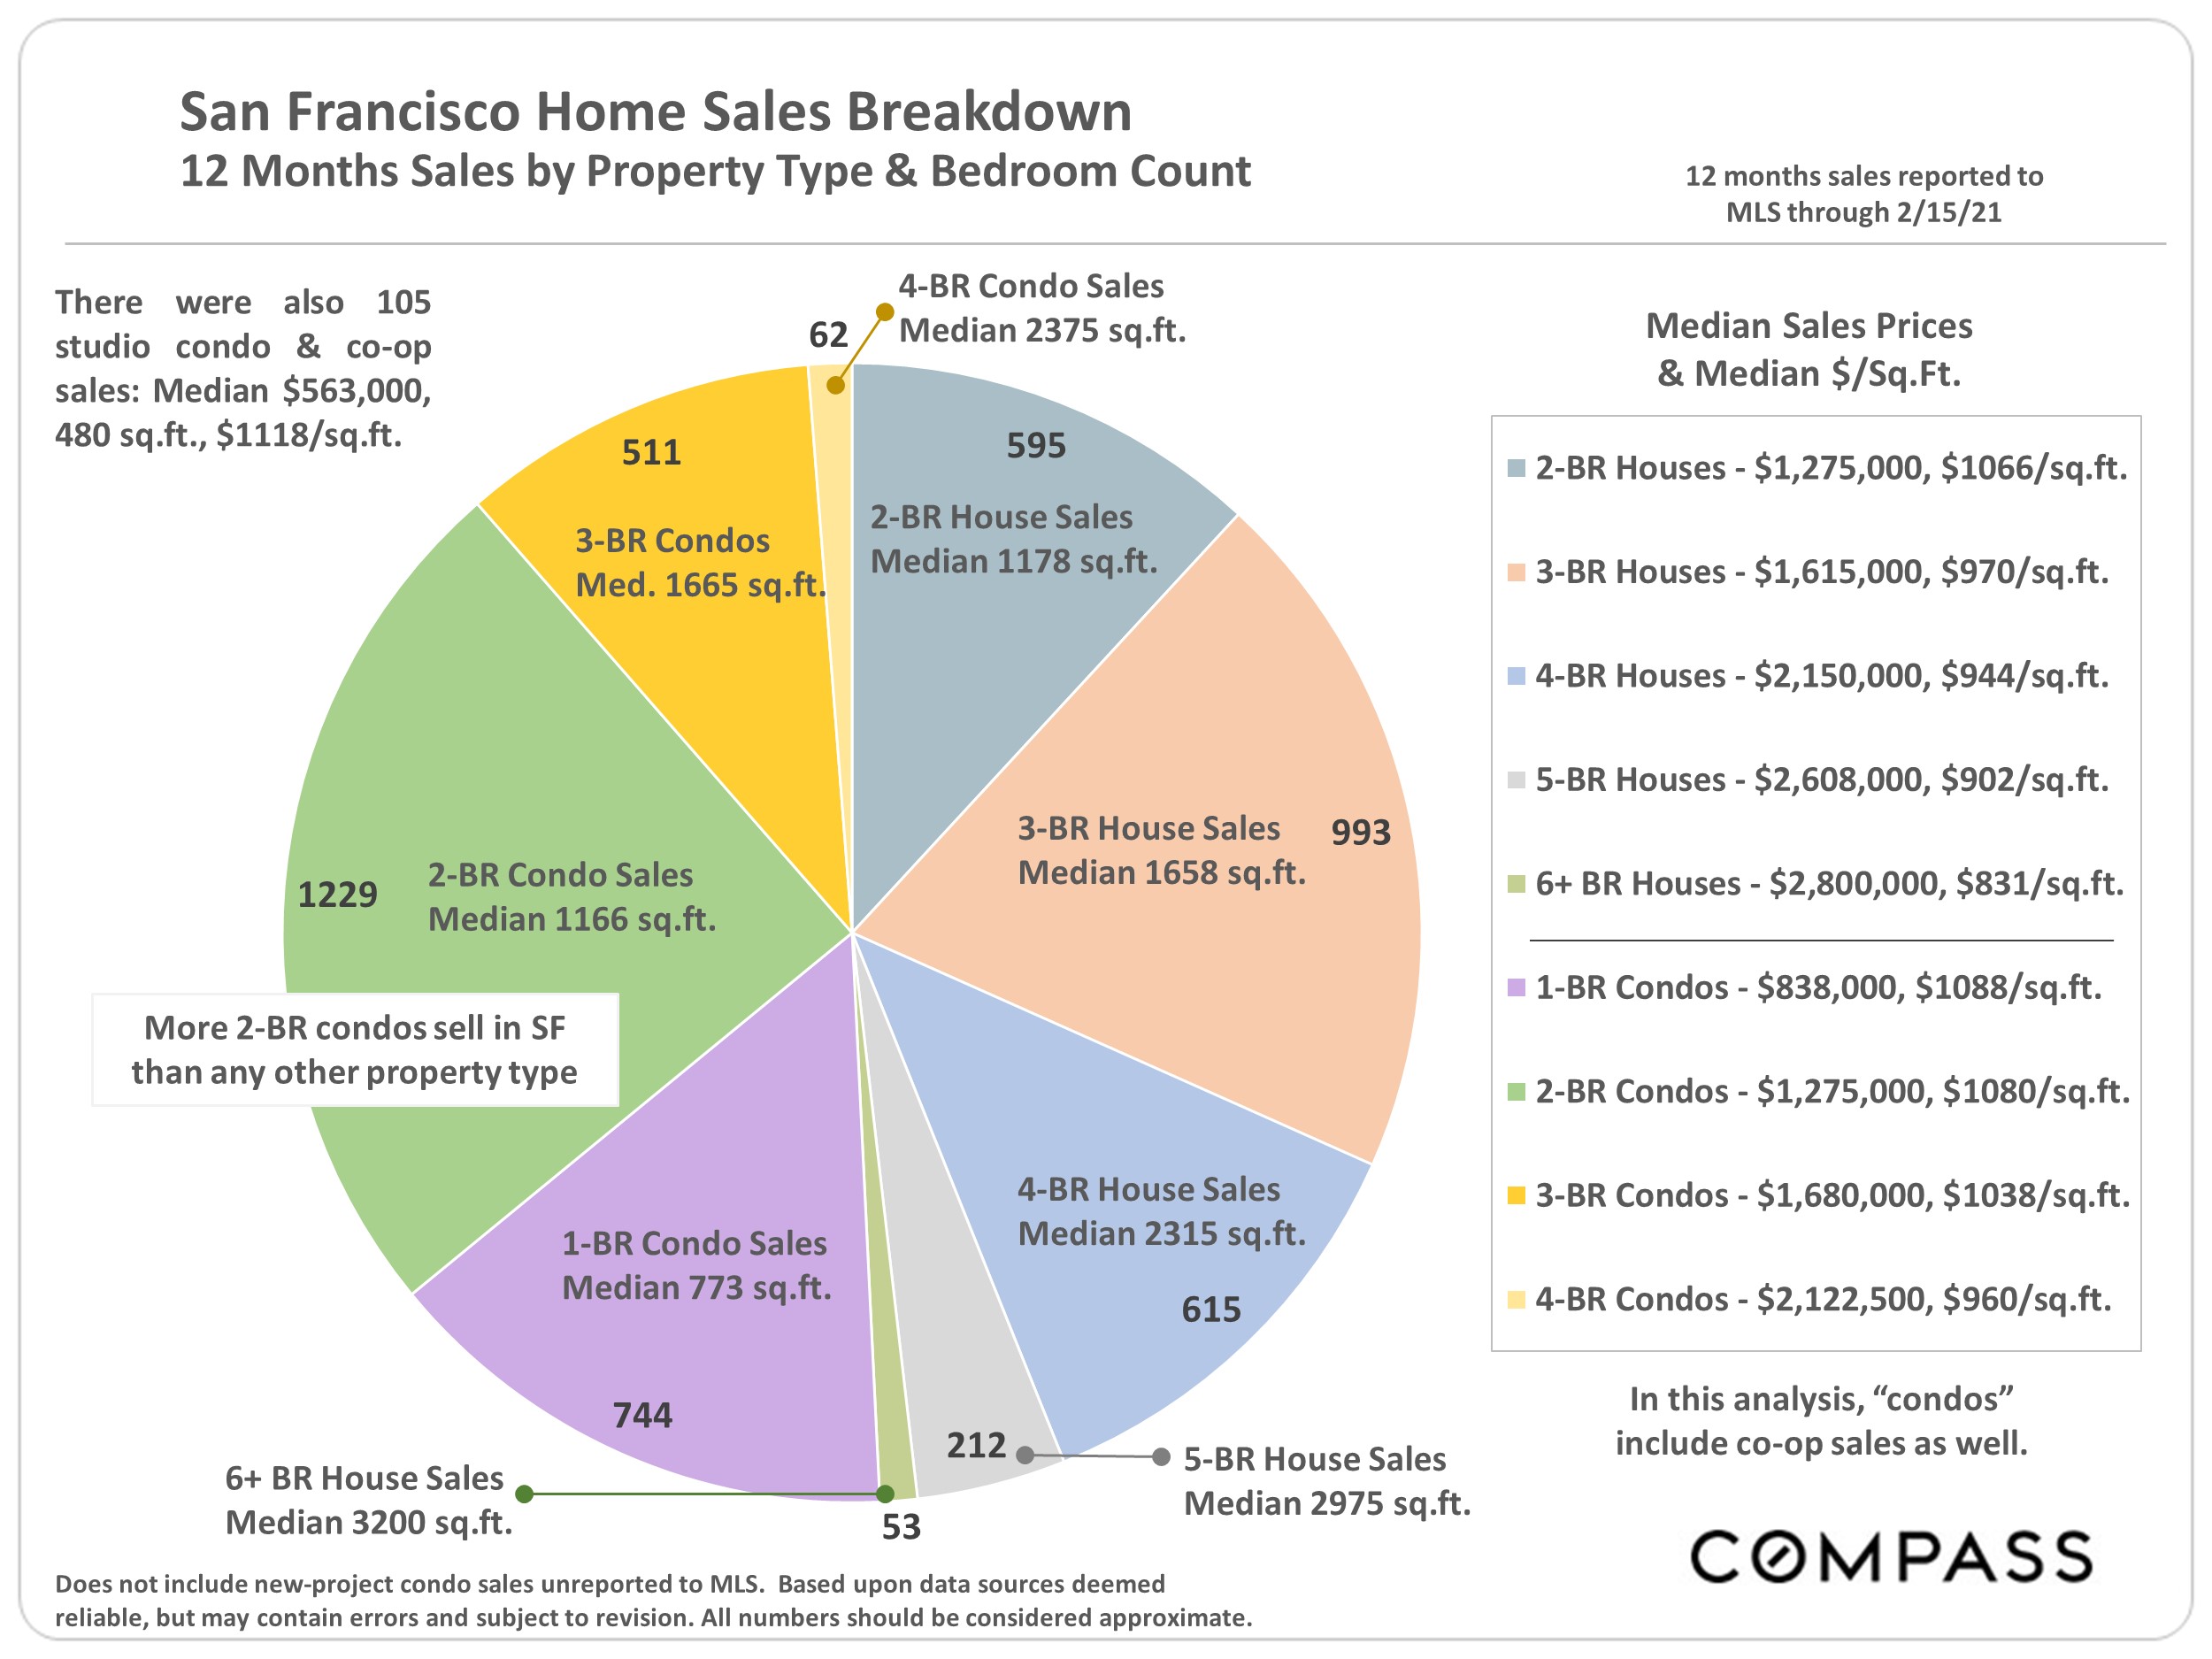
San Francisco home sales breakdown infographic with a pie chart by property type and bedroom count.

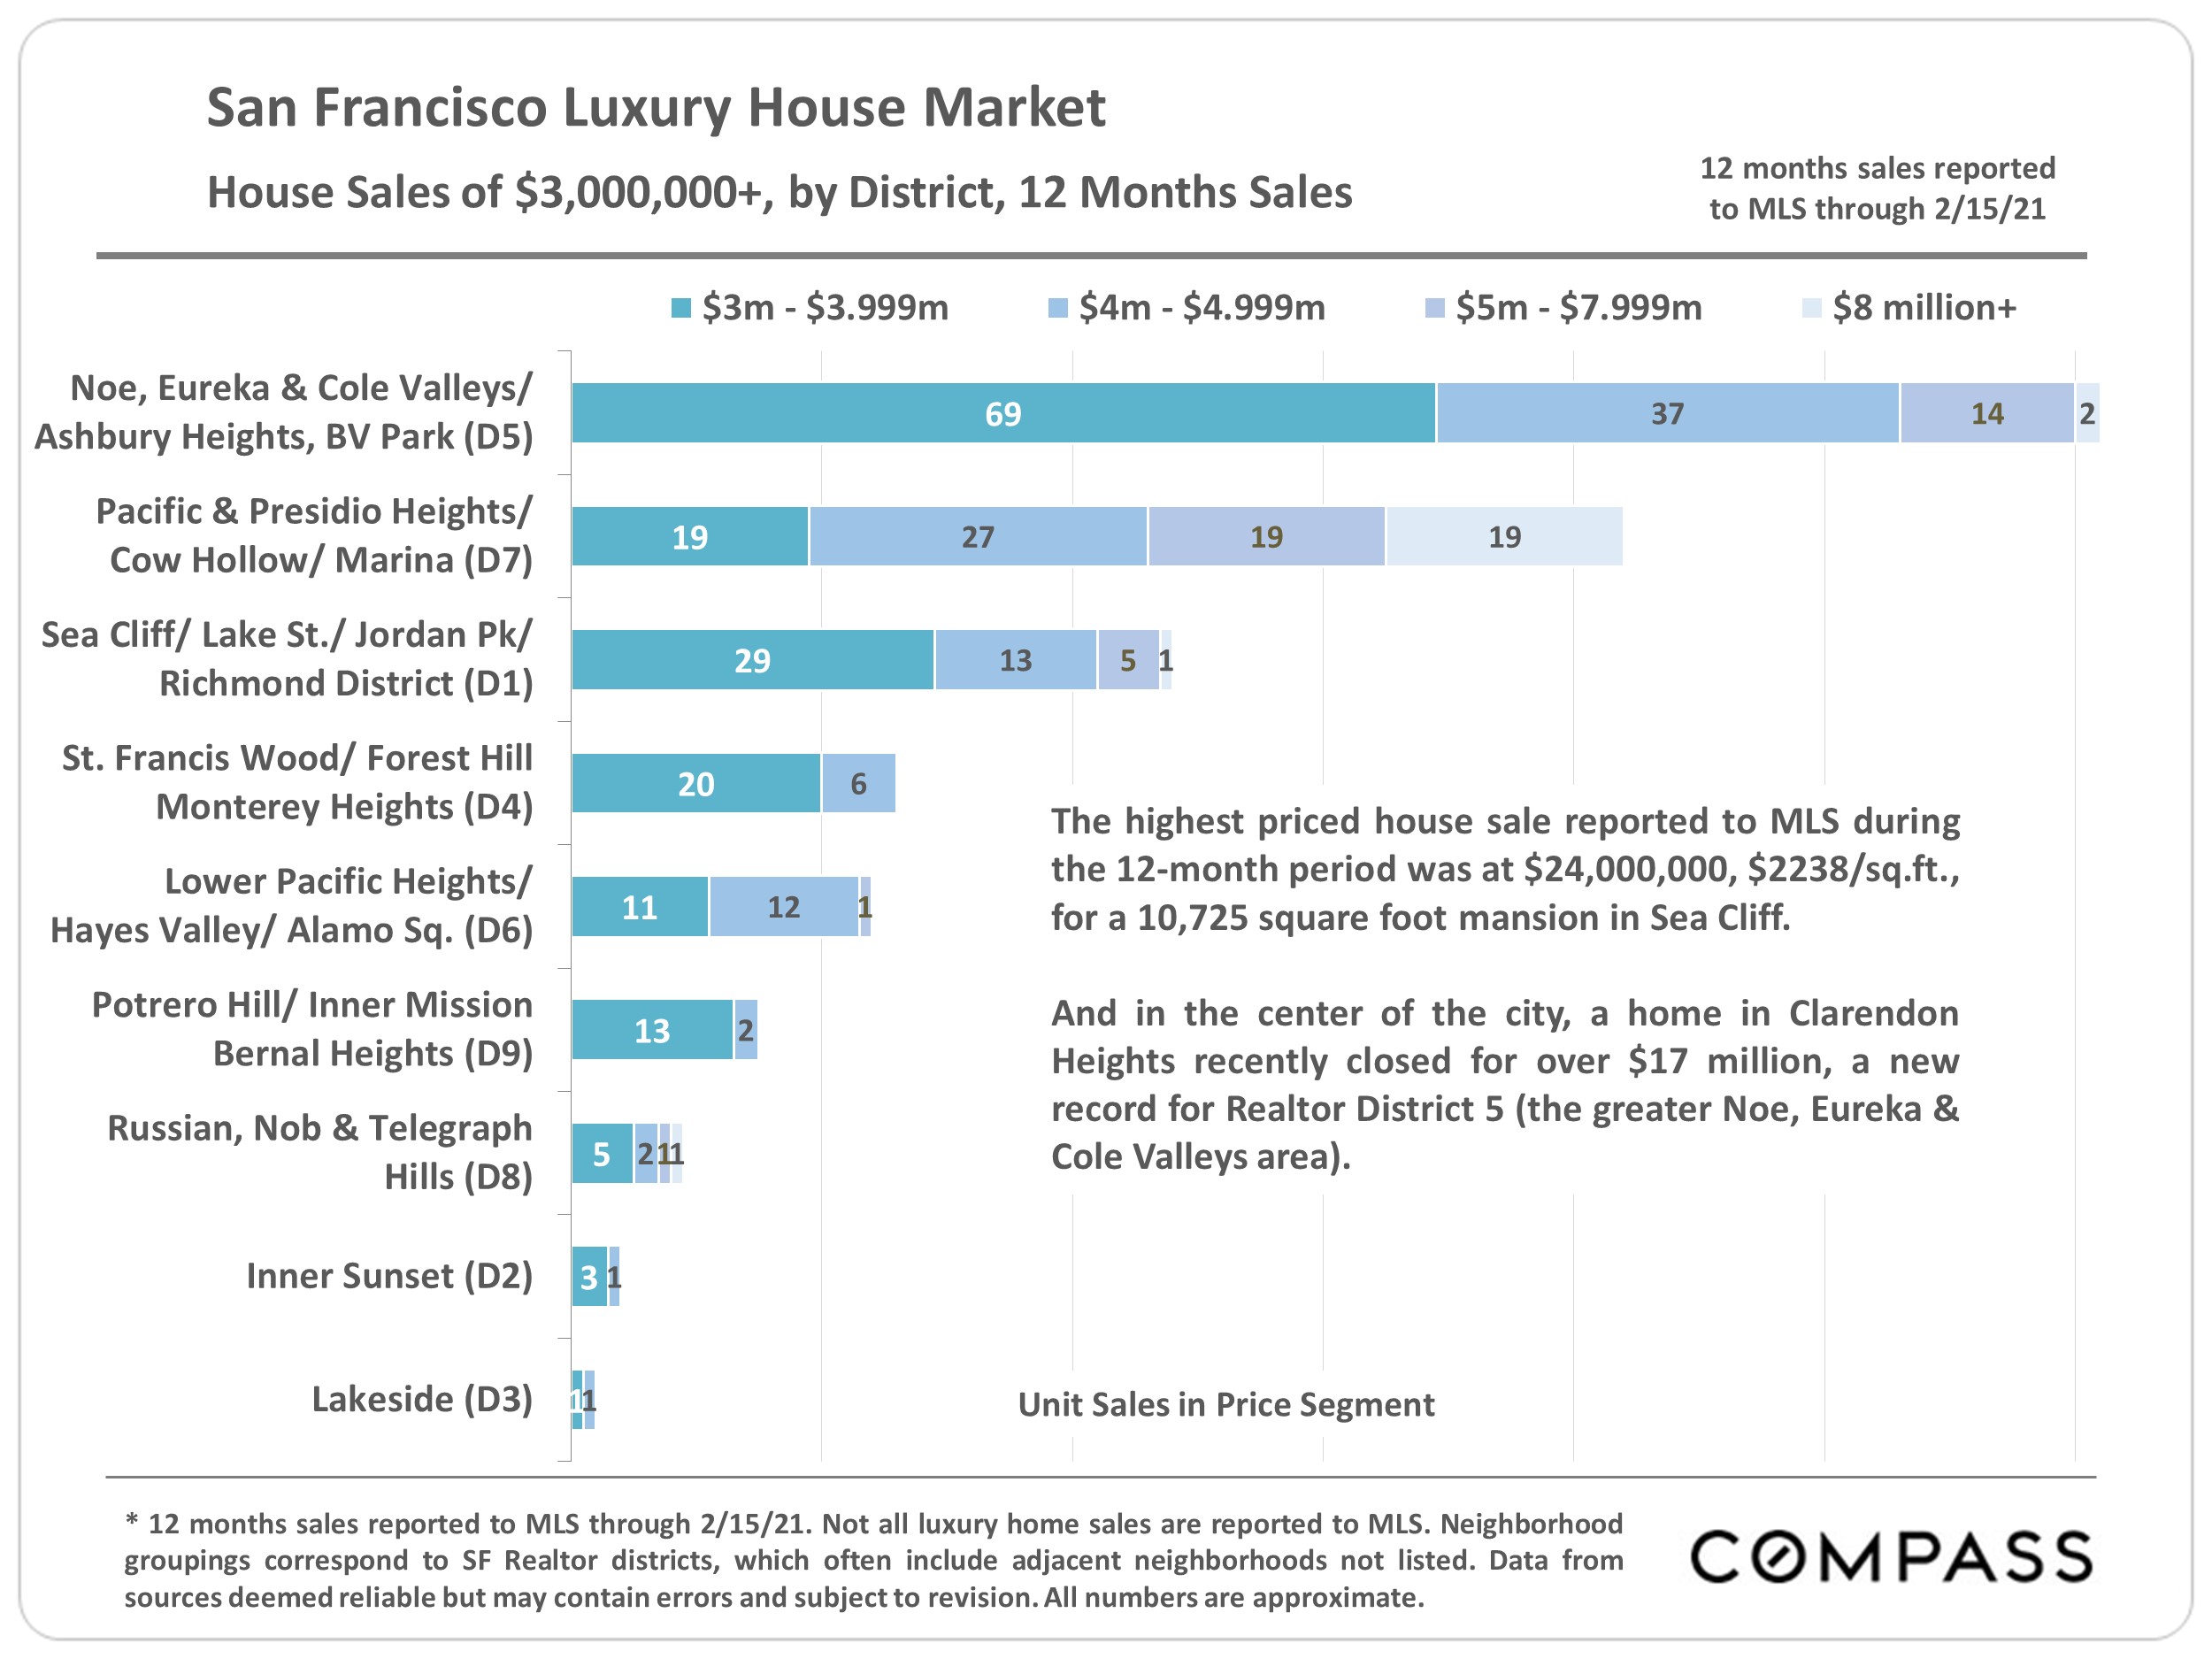
Chart of San Francisco luxury house sales by district and price range, with Noe Valley leading in $3 million-plus sales.

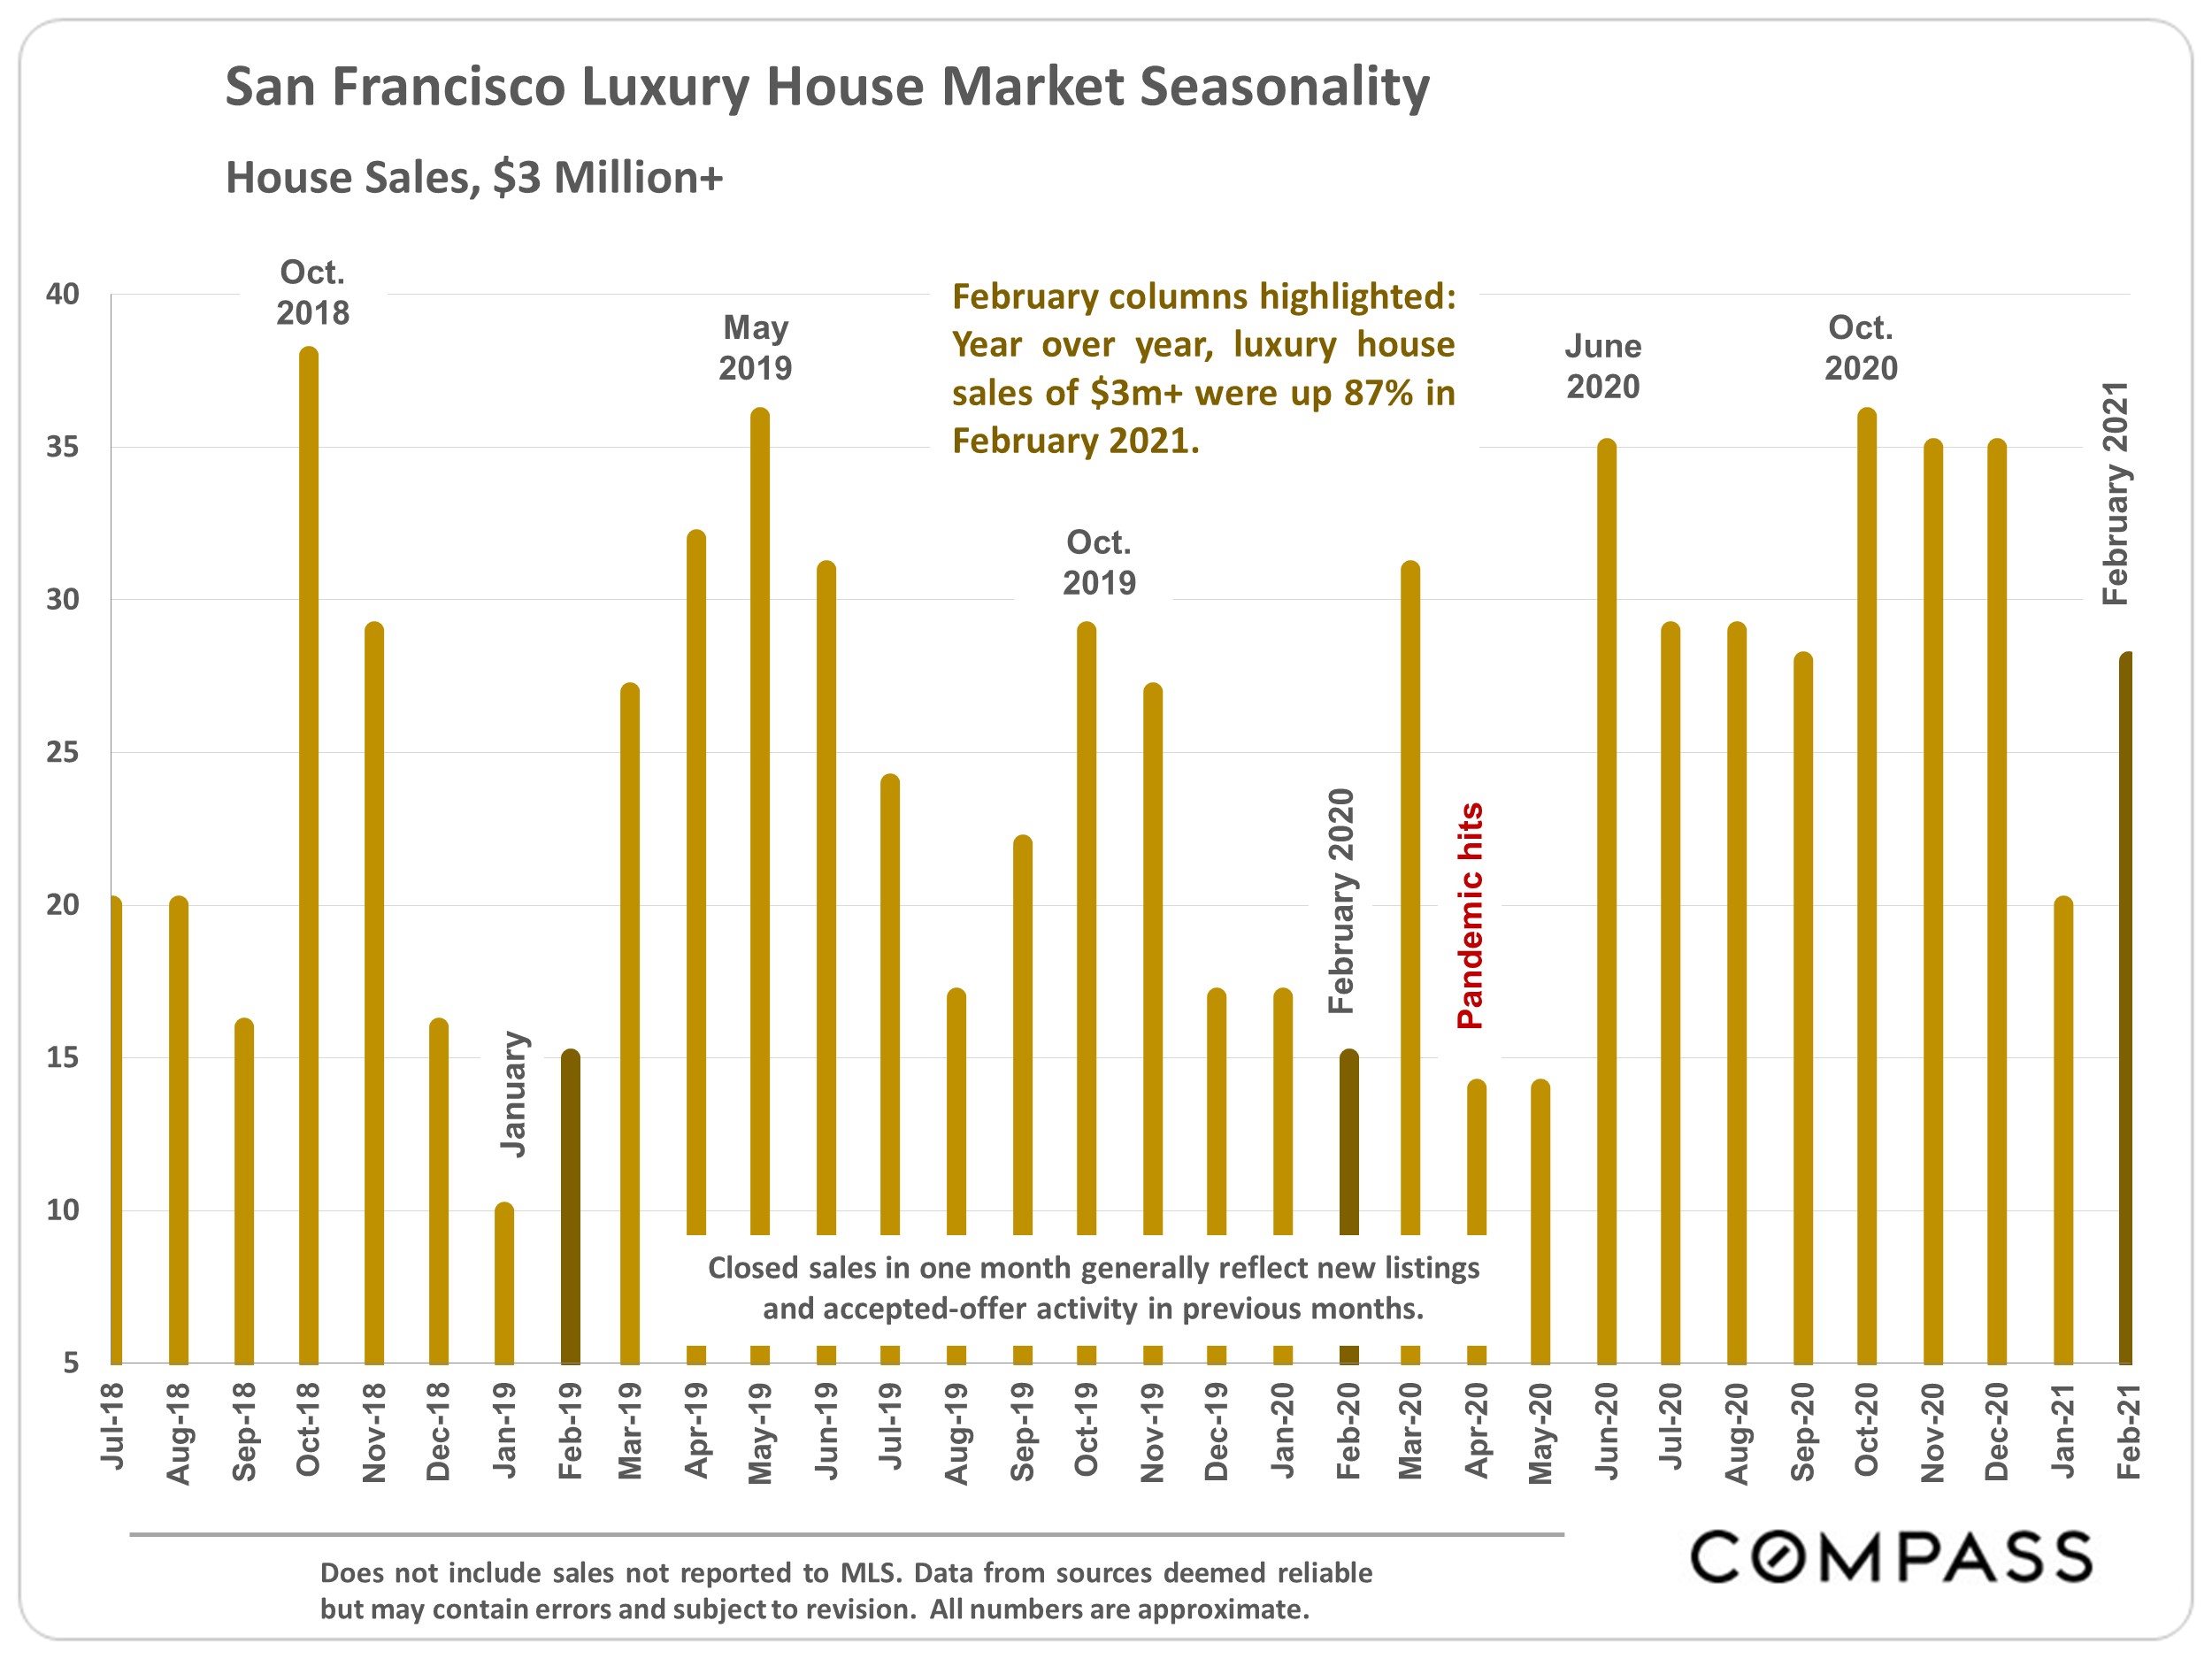
Chart of San Francisco $3 million-plus house sales by month, July 2018–February 2021, noting an 87% annual rise in February.

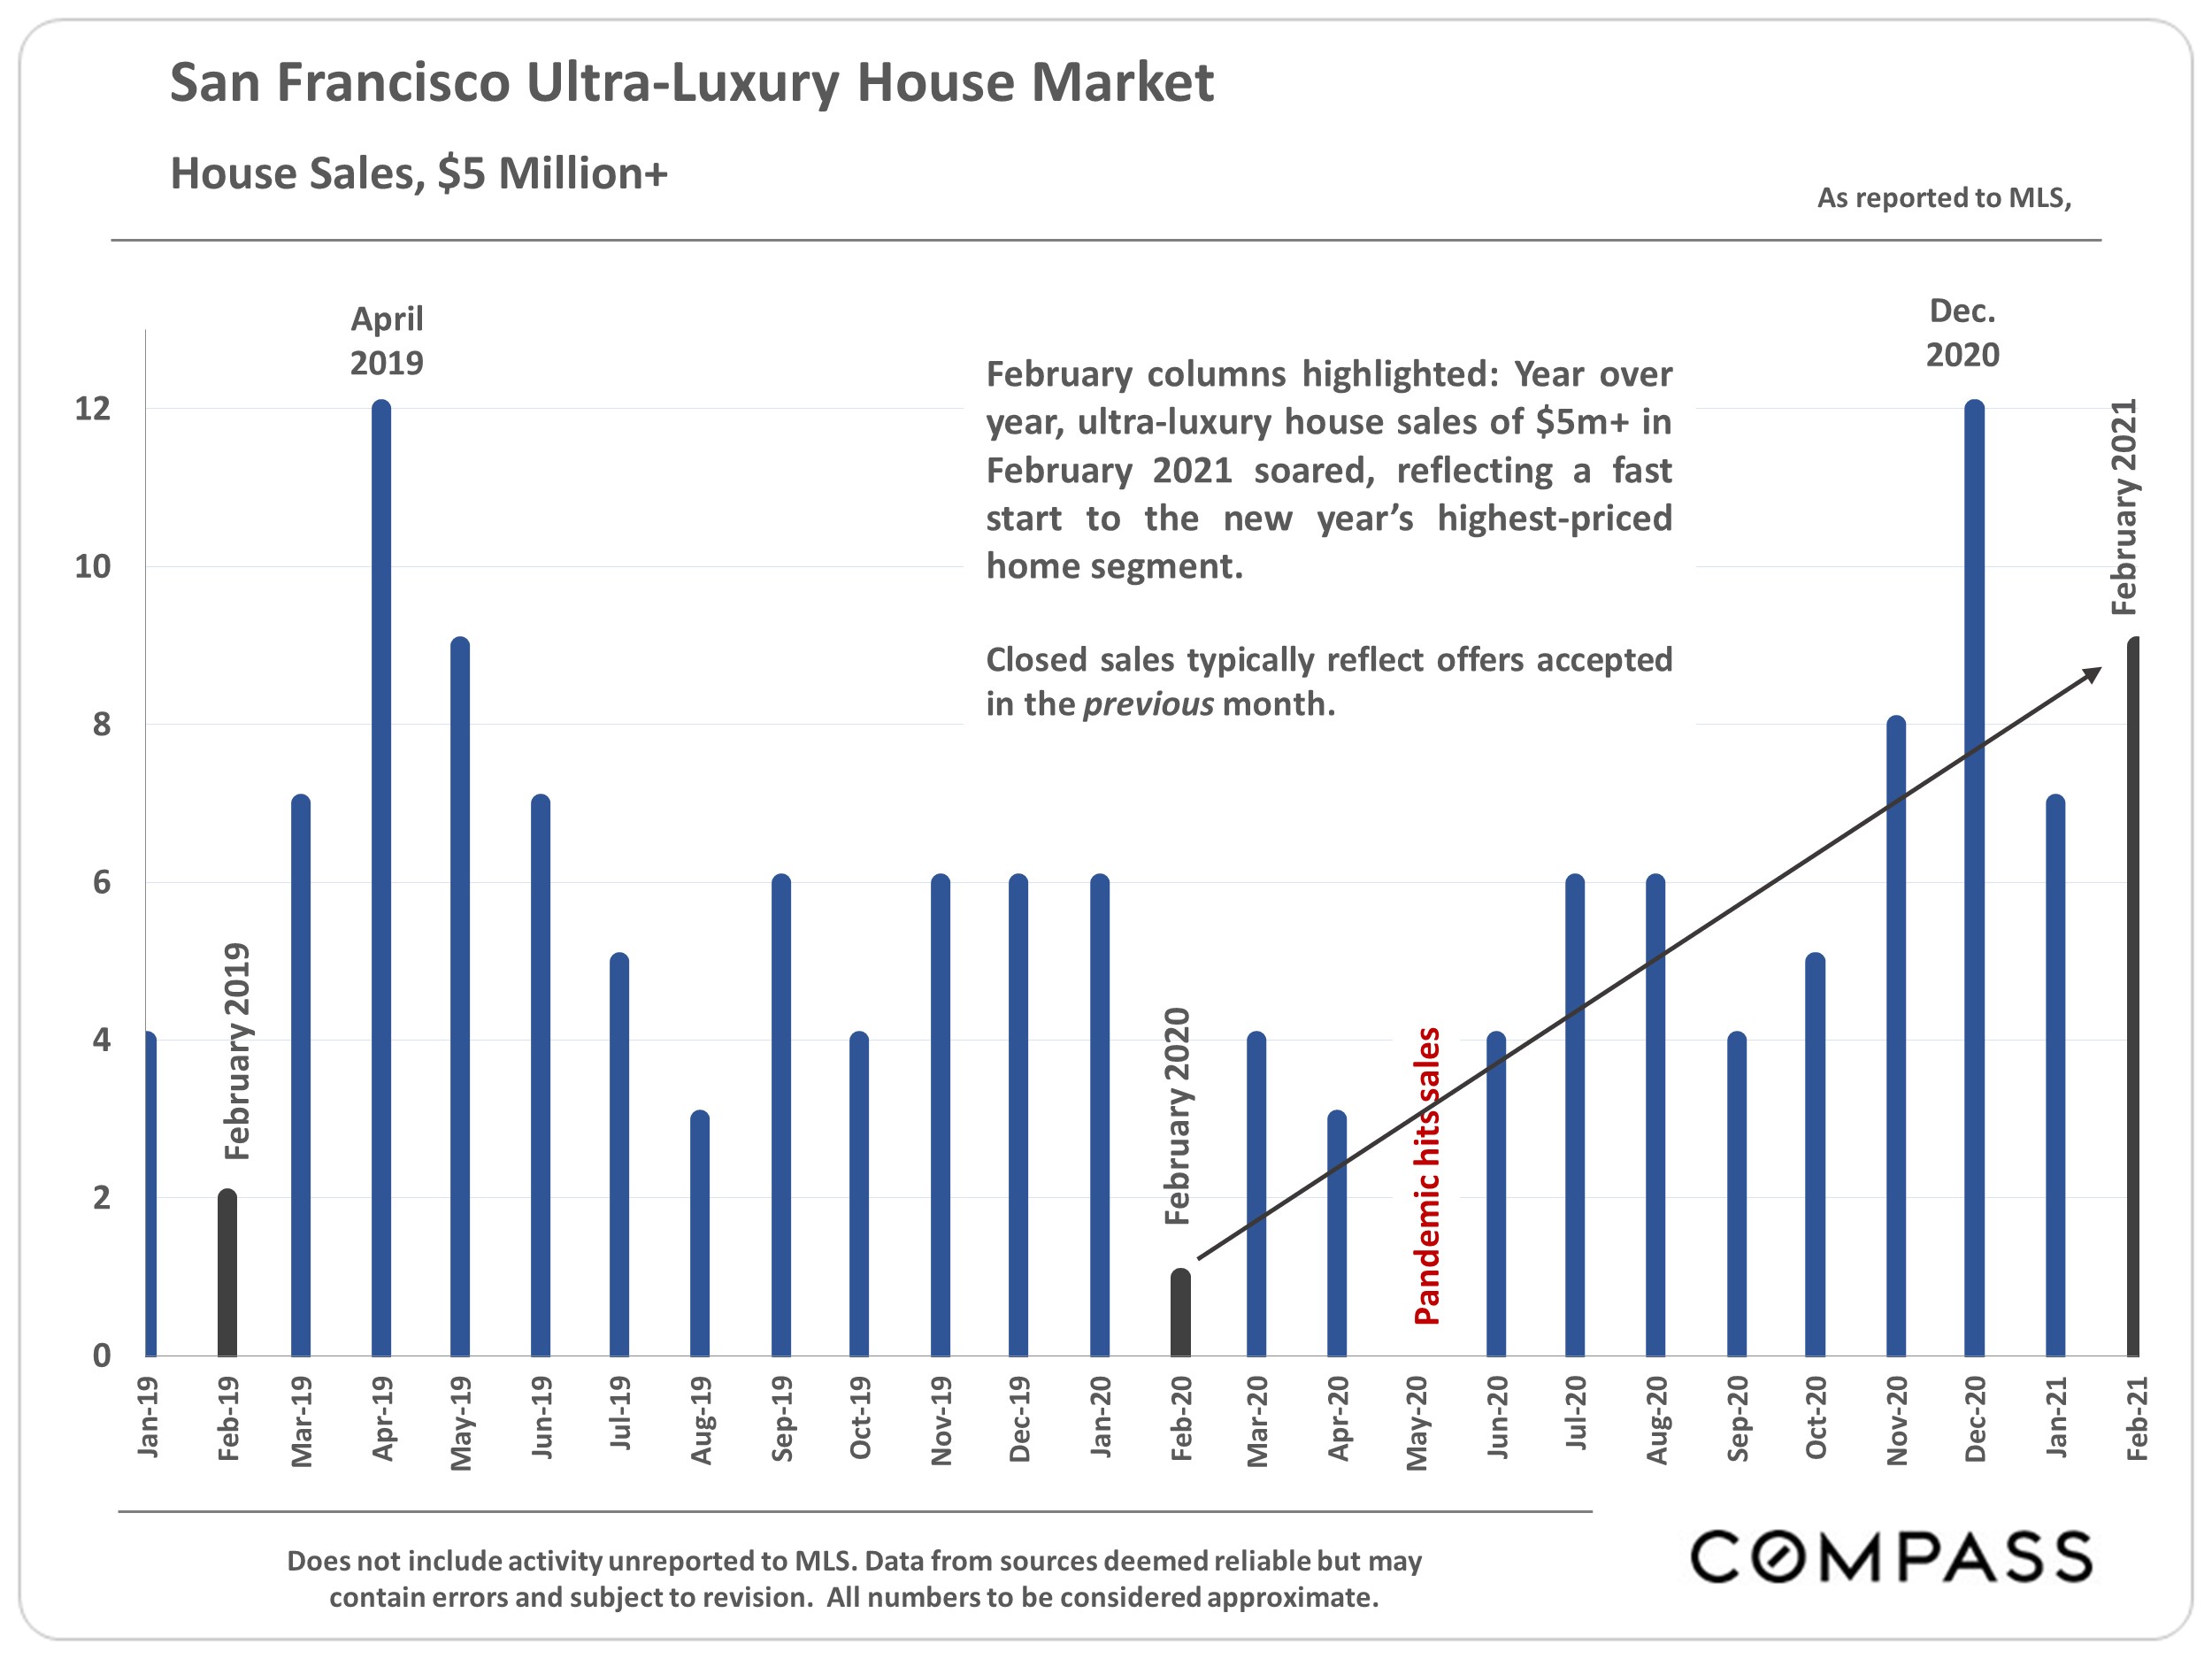
Chart of San Francisco $5 million-plus house sales, showing a February 2021 surge after the pandemic downturn.

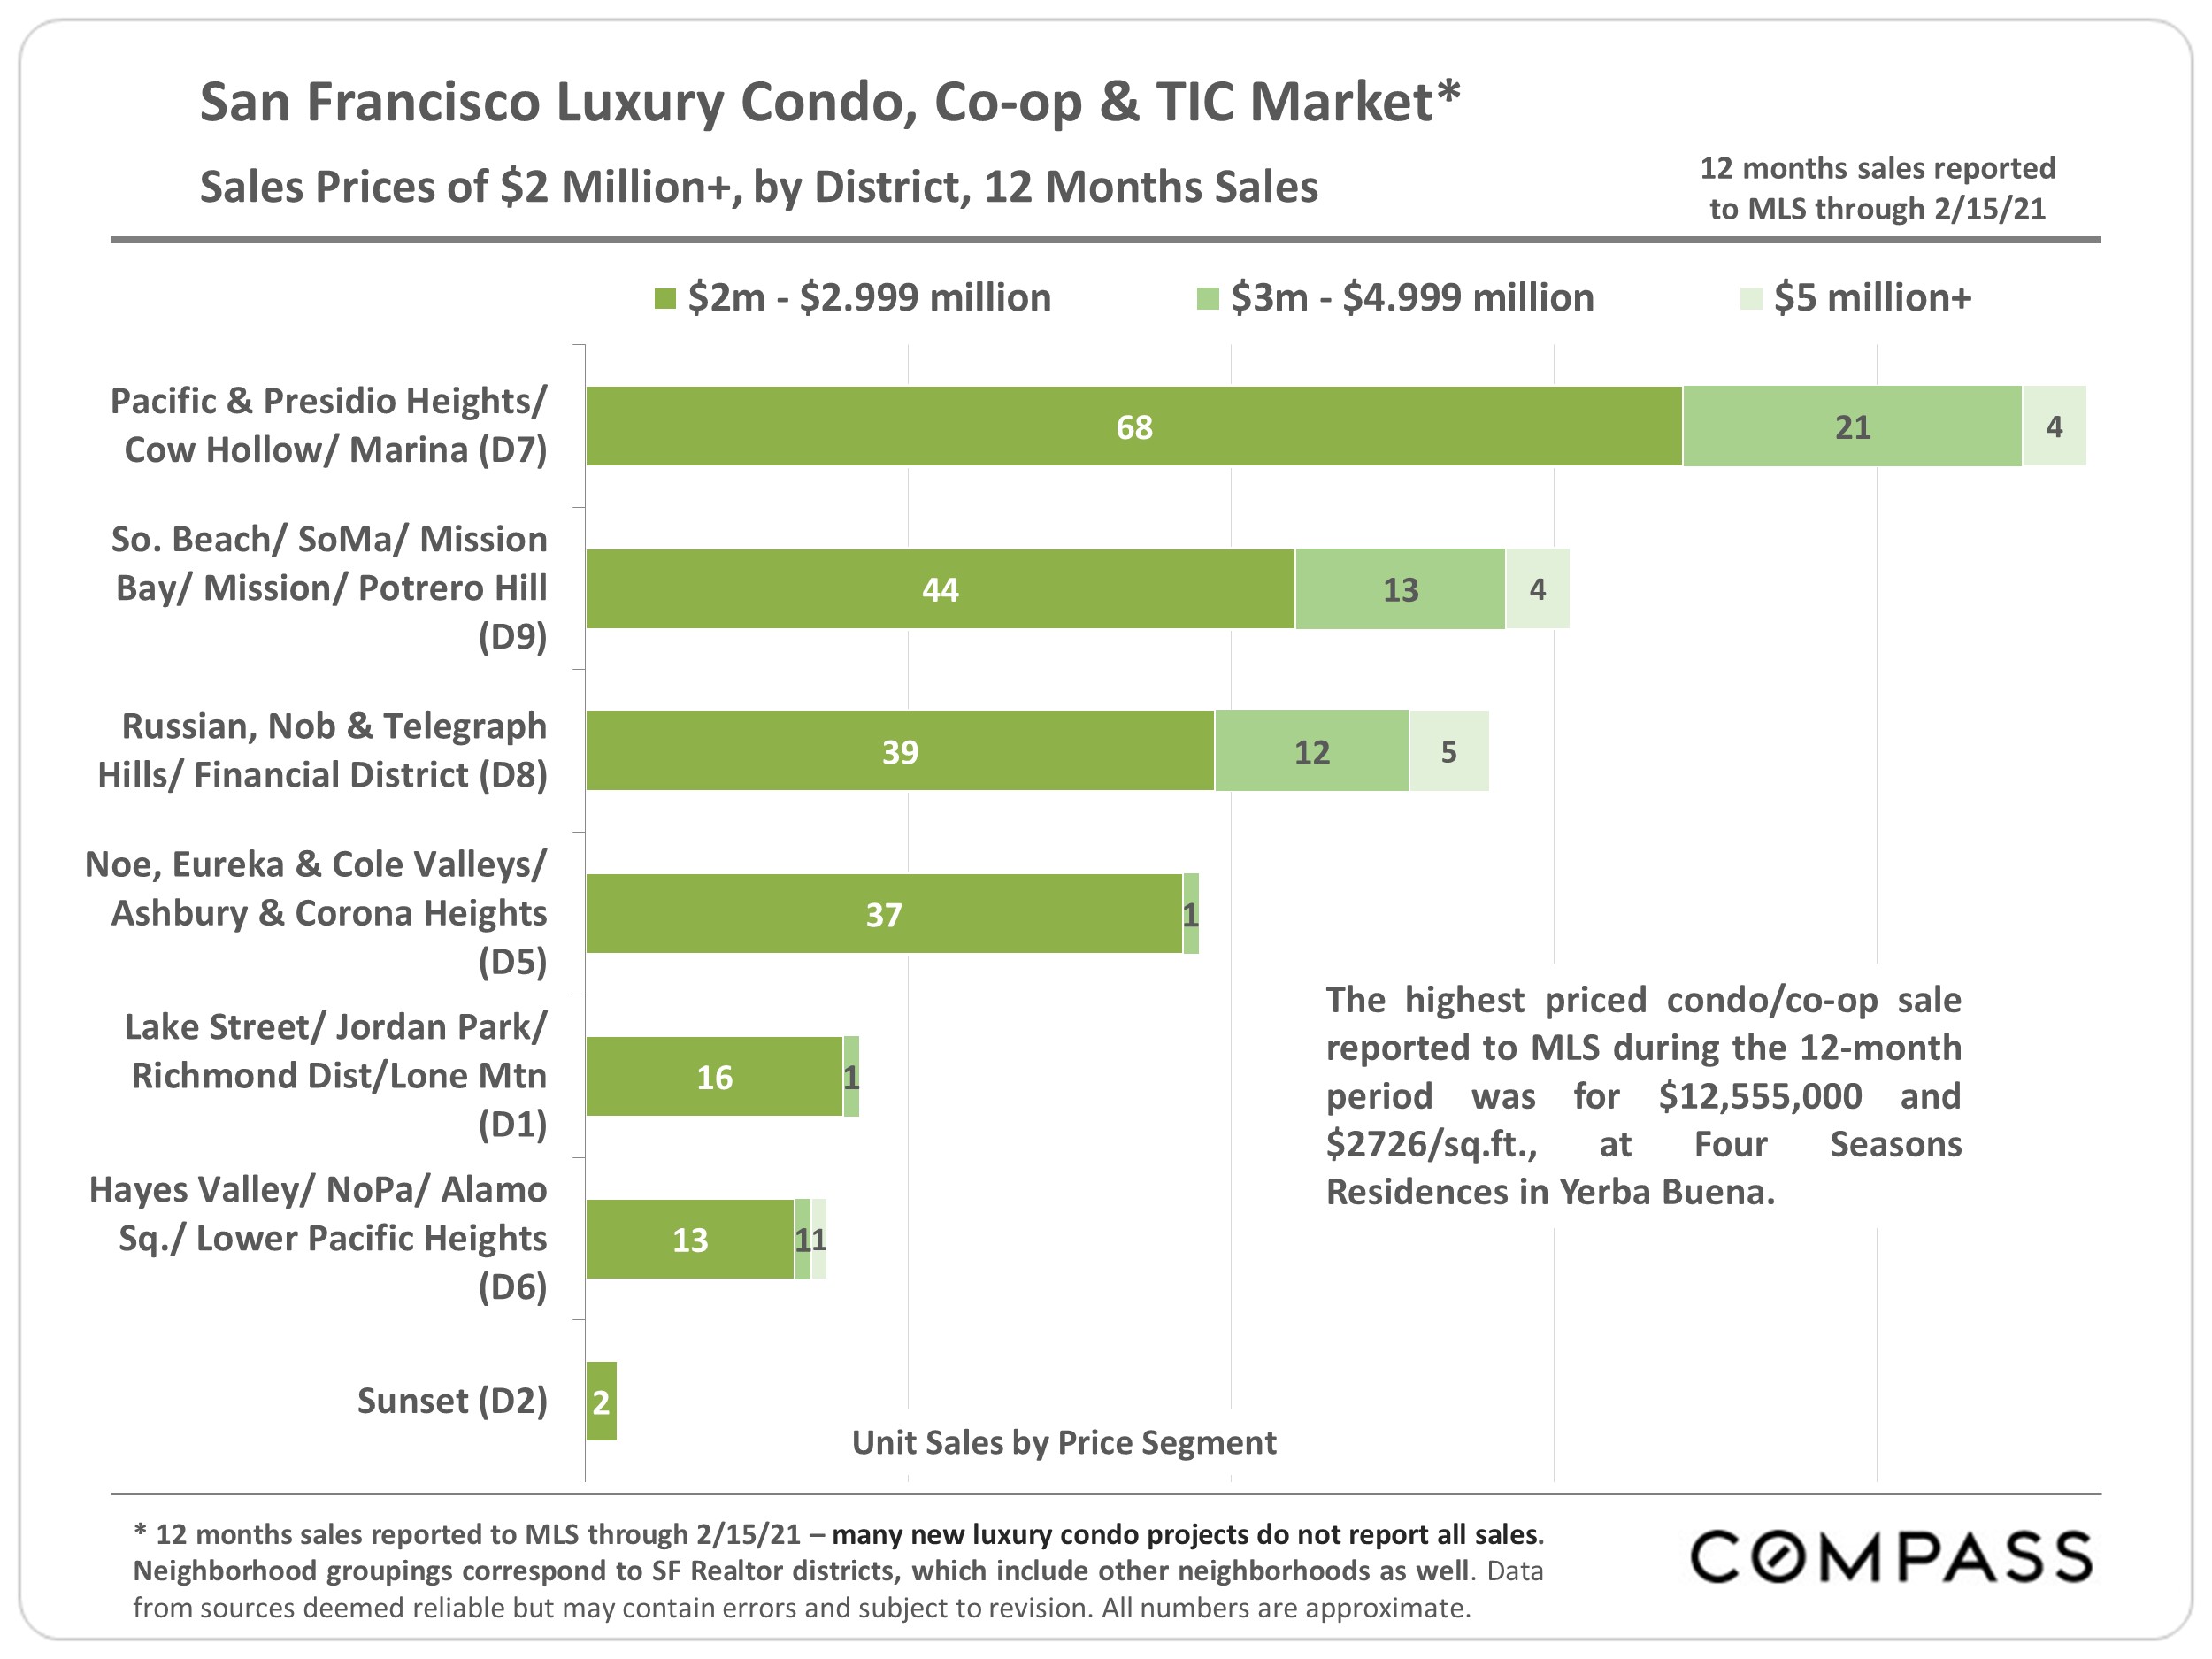
San Francisco luxury condo sales chart by district and price segment, with Pacific Heights leading.

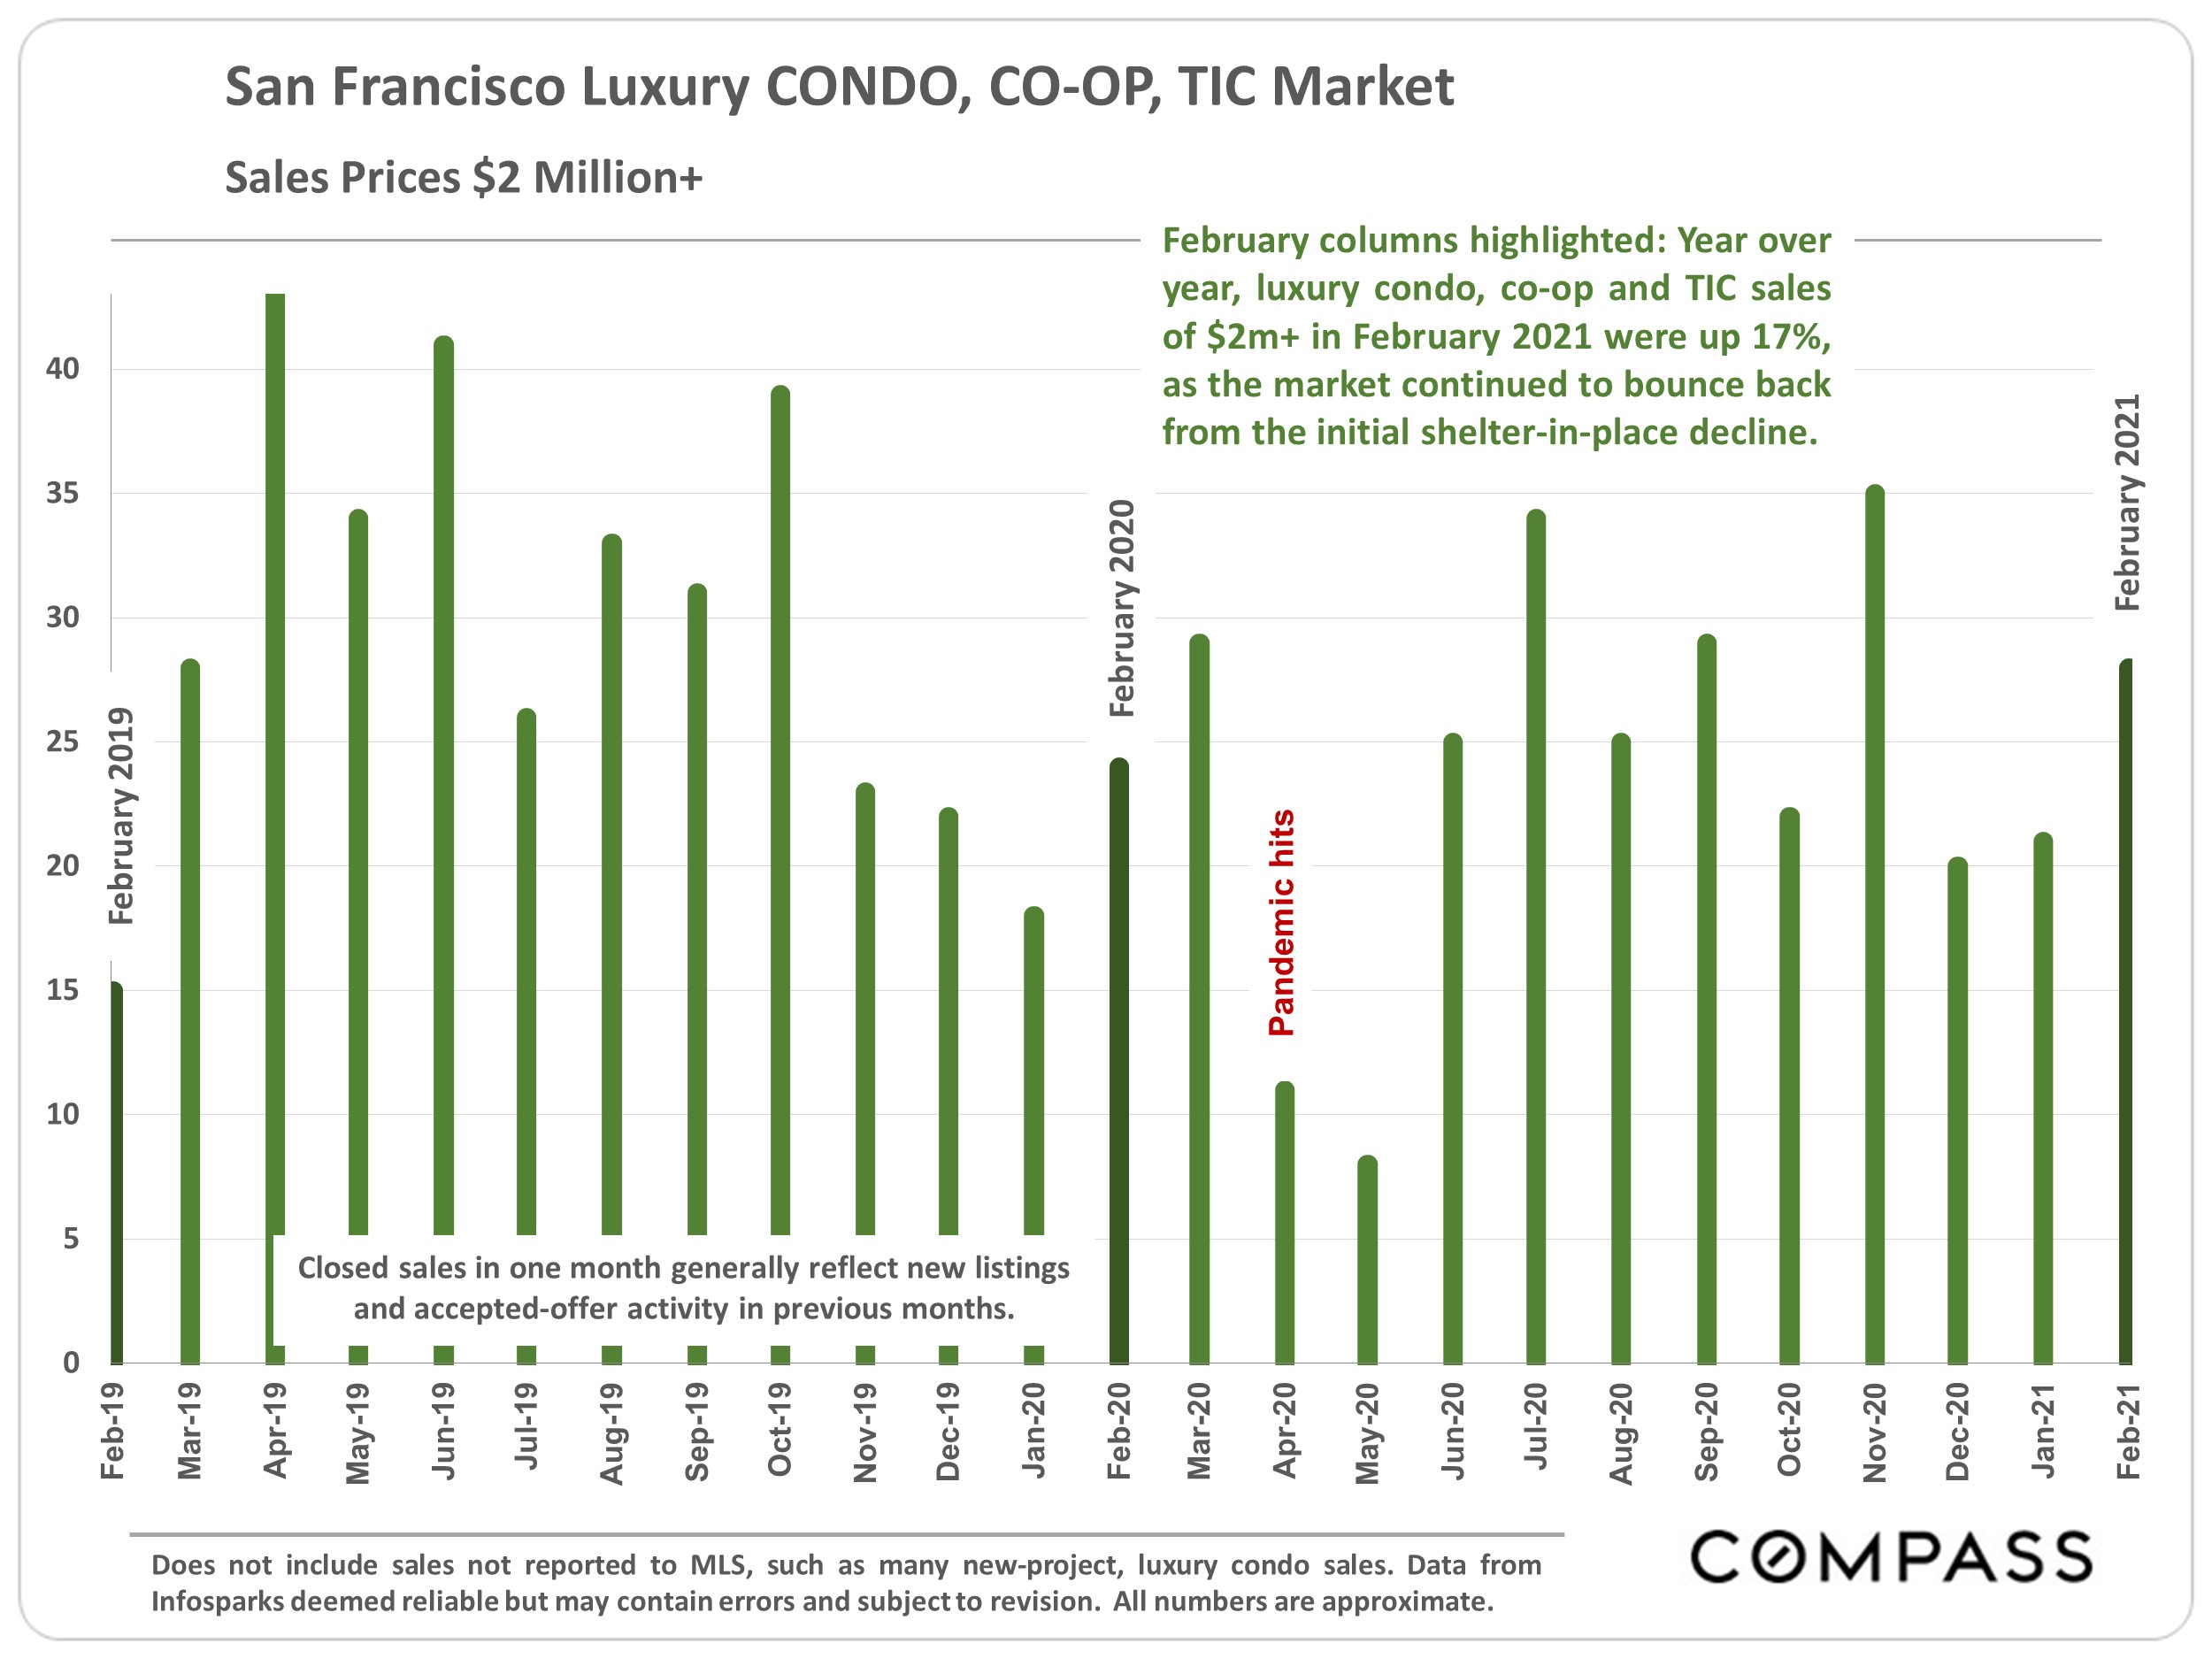
Chart of San Francisco luxury condo, co-op, and TIC sales over $2 million, highlighting February 2021’s 17% year-over-year increase.

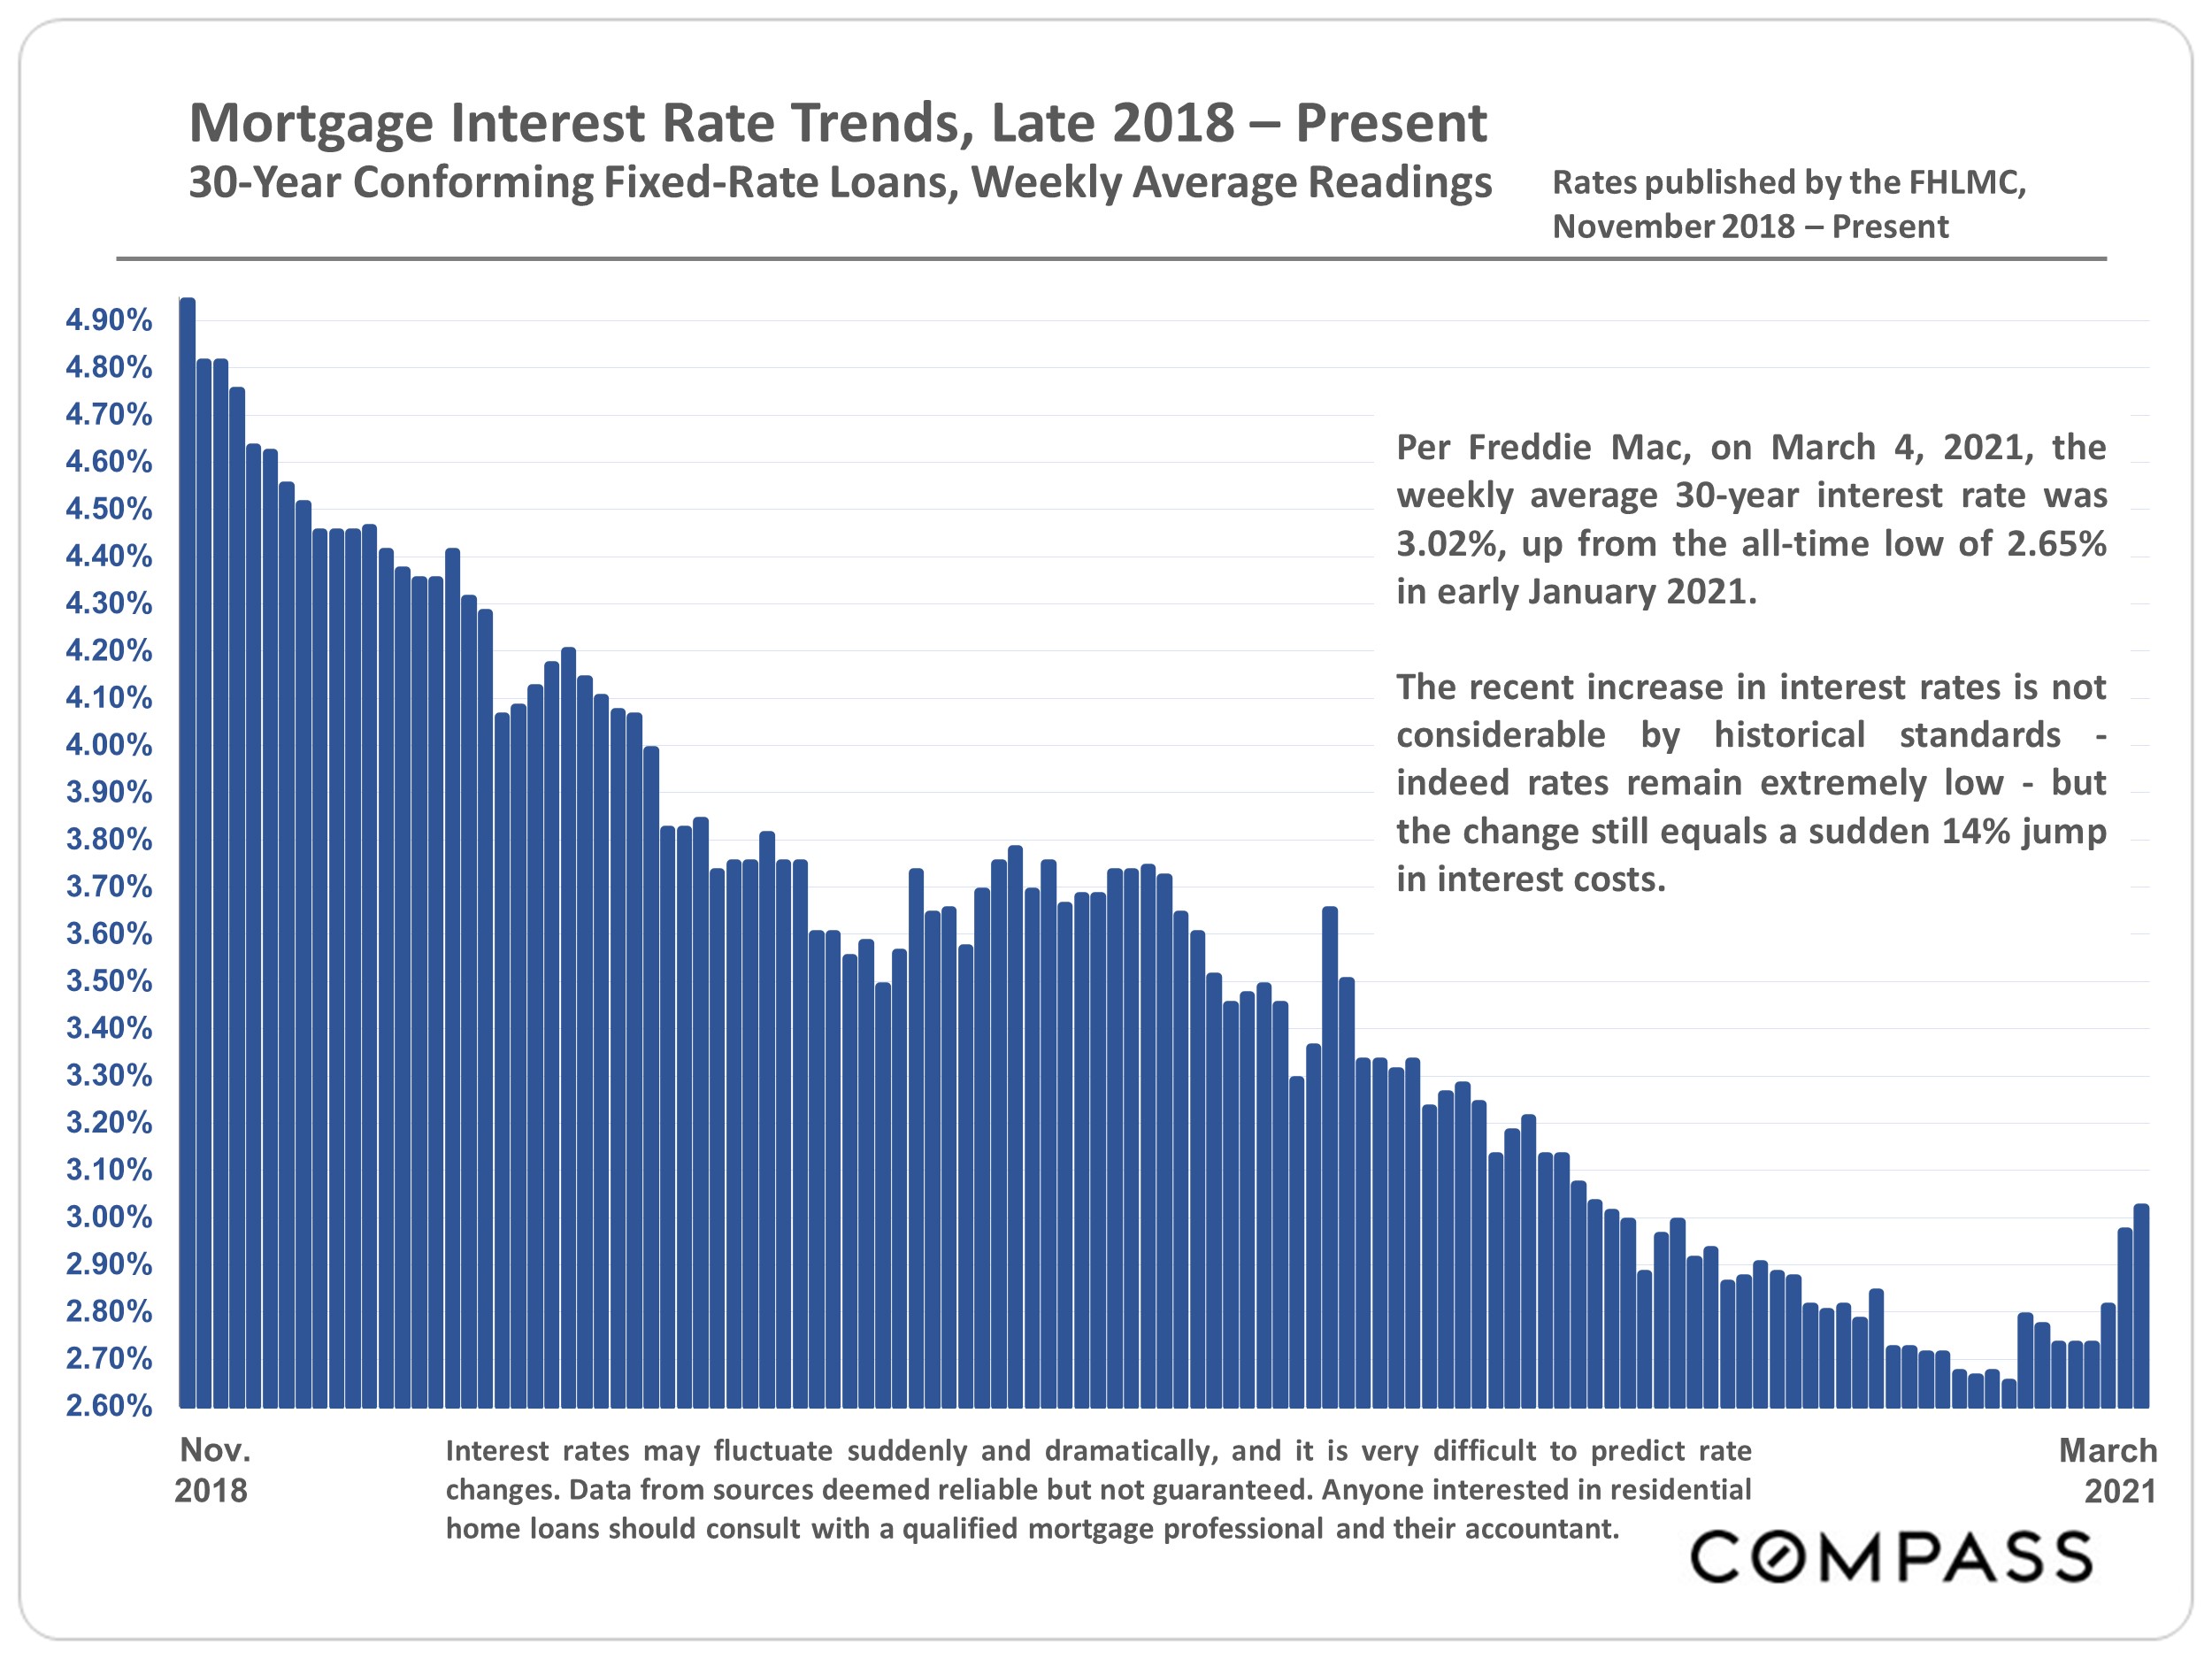
Chart of weekly 30-year mortgage rates, declining from late 2018 lows near 4.9% to about 3% in March 2021.

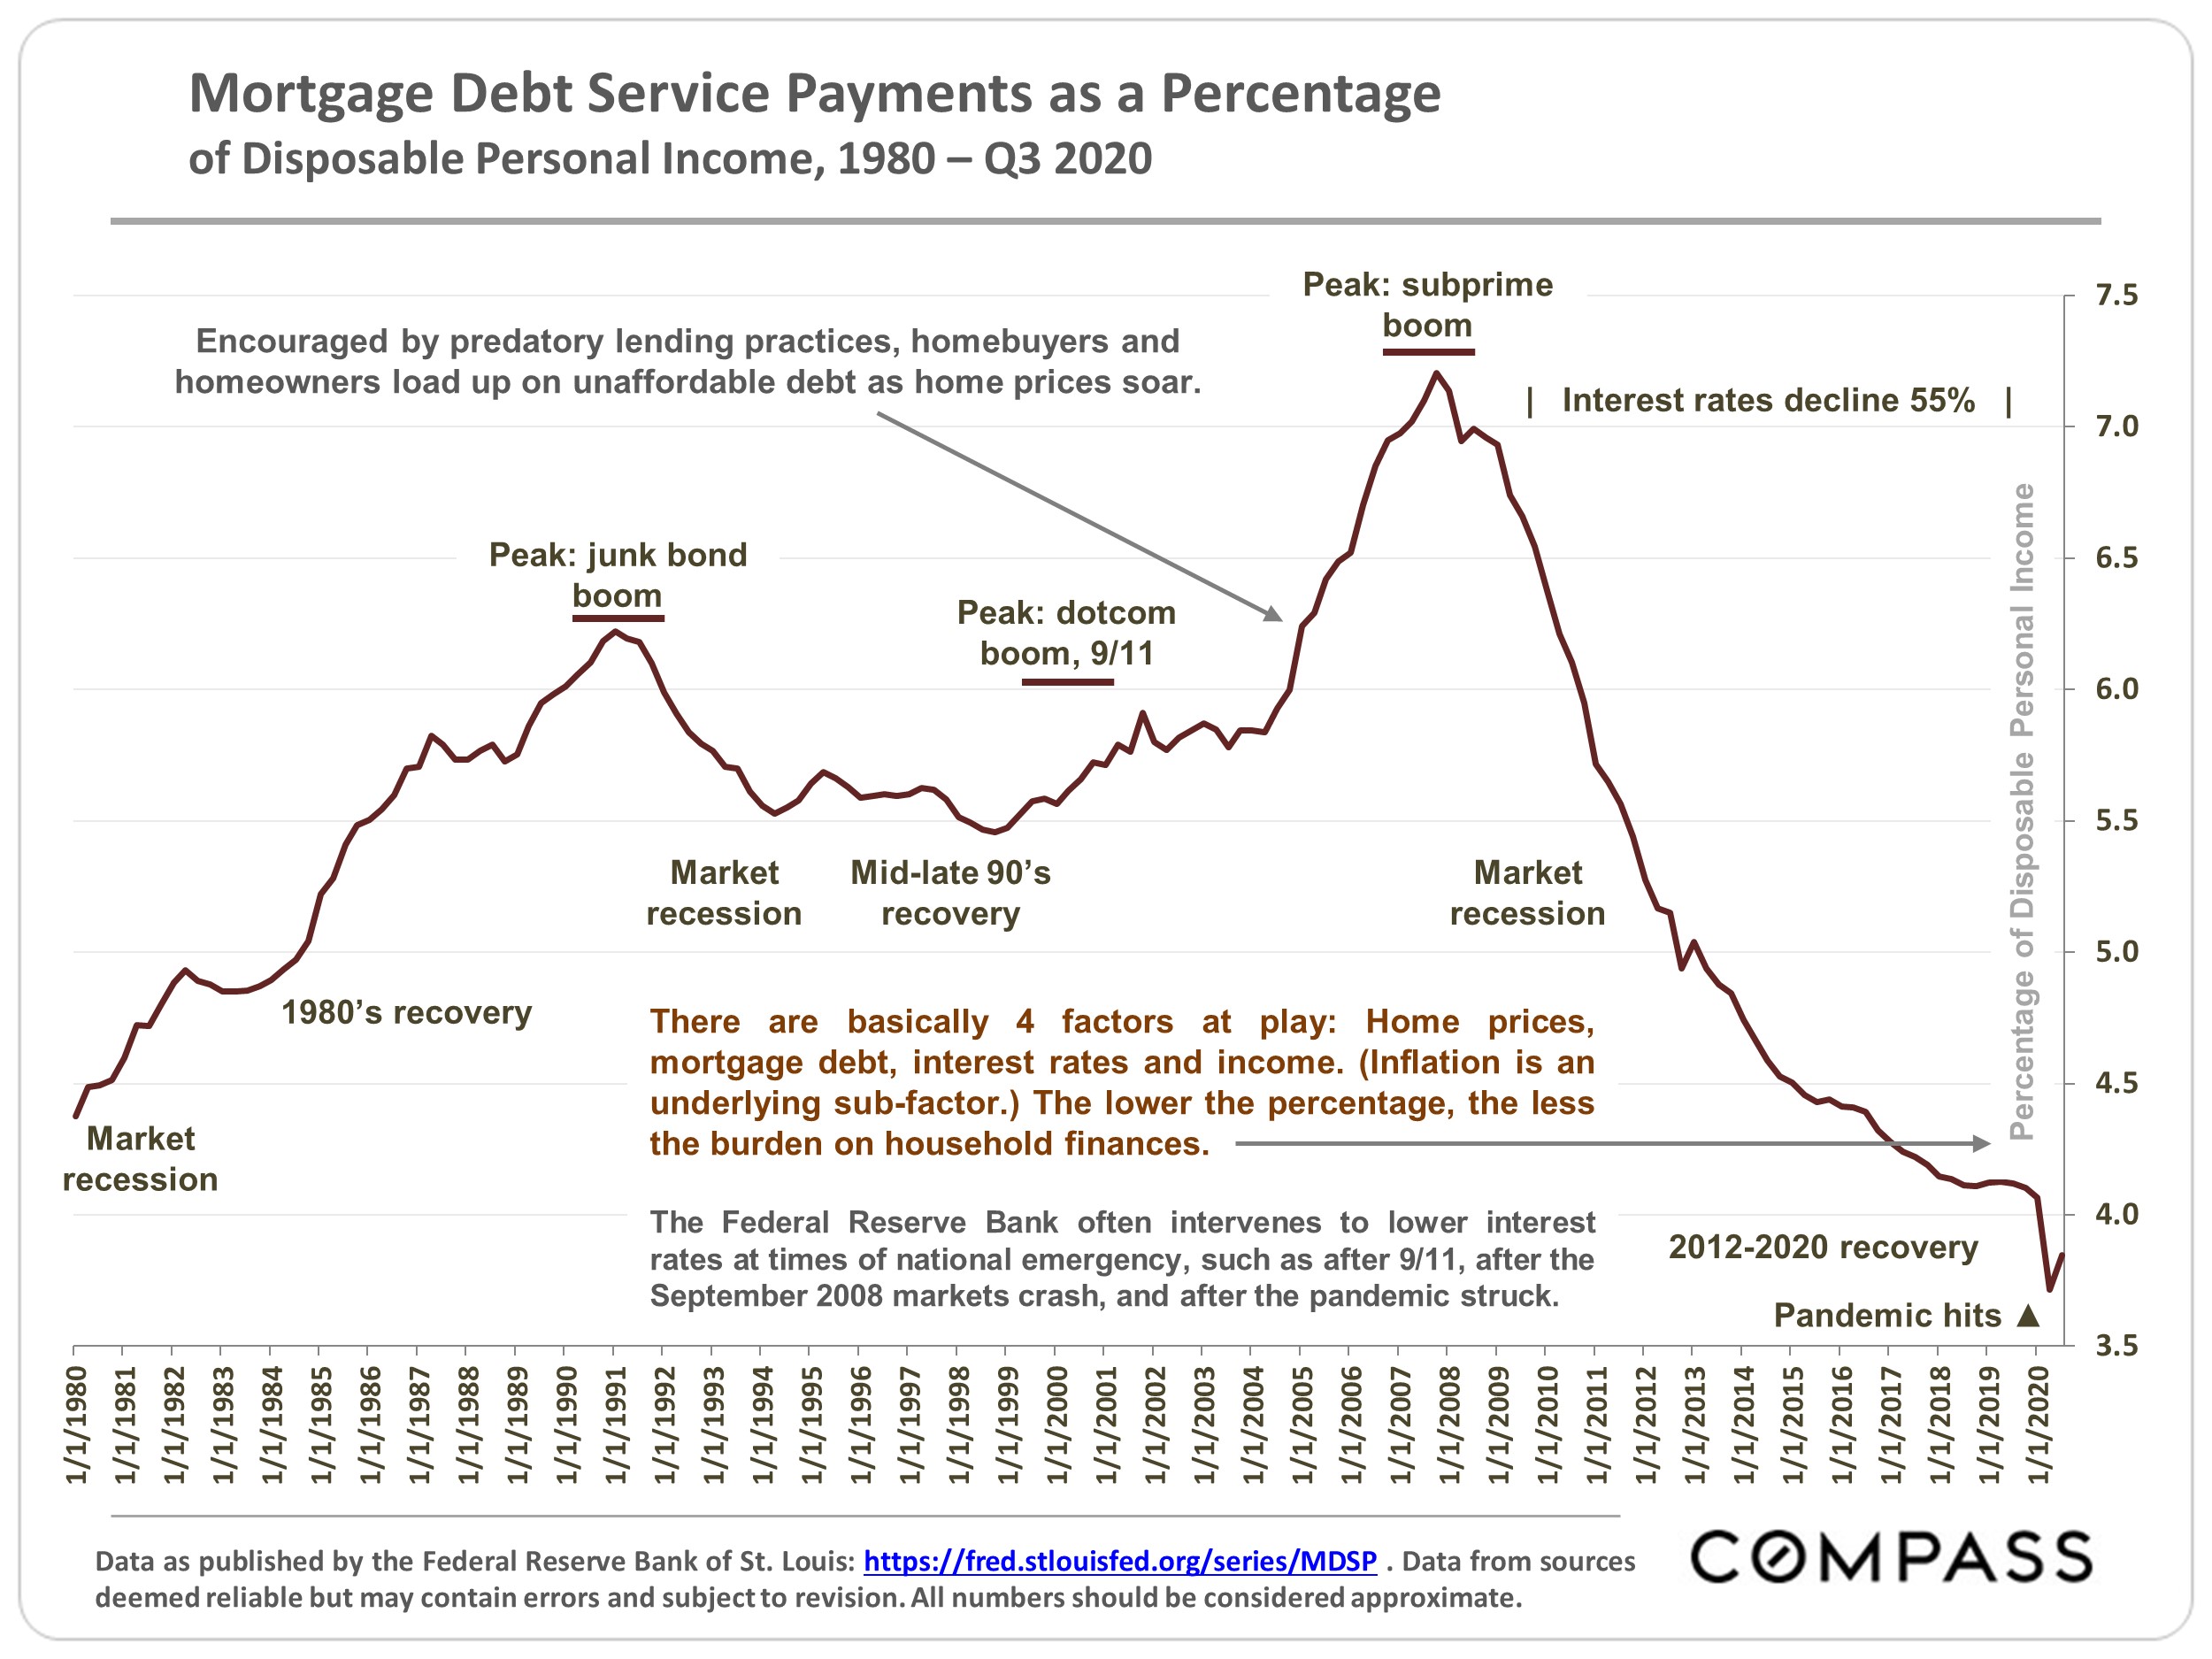
Chart of mortgage debt service as a share of disposable income, 1980–2020, with peaks and recession annotations.


Know Your Value


Curious to learn your home's projected worth? 

Click "Home Valuation" below to receive a
FREE personalized report for your home! 


Home Valuation

Work With Us

Susie is currently the proud founder and owner of Susie Lee Group, a team comprised of talented Realtors and professionals that specialize in guiding real estate transactions within the San Francisco and Bay Area market.

Contact Us